Hi everyone — I’m back from my trip and ready to start nerding out again. While I was out, S&P released the Case-Shiller figures for March, which indicated that despite the strength in the median price, home pricing power is still declining (or at least was declining as of March).
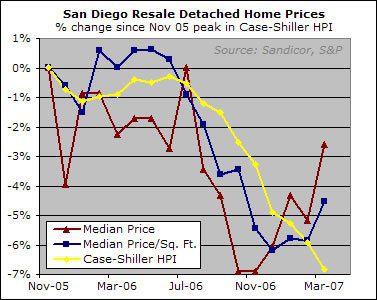
Notice in the chart above how the size-adjusted median and even, to a lesser extent, the plain vanilla median do a decent job of directionally tracking the HPI up until around December 2006. At that point, as you all know, the problems in the subprime lending business began, and the resultant tightening caused a decline in low-end property purchases. The apparent strength in the median indicators is caused by a compositional shift to more expensive properties, but it is masking an actual decrease in pricing power.
Interesting enough, but I’m sure it won’t prevent people from continuing to call the bottom of the market based on strength in the median price.
What’s also interesting is that we are seeing no sign of seasonal strength. The HPI was pretty much flat during the first three months of 2006, whereas it has declined by 2% during the first three months of 2007 (an annualized rate of 8%). It will be interesting to see what happens when the increasing must-sell inventory meets the the seasonally strong months ahead.
I wonder what would happen
I wonder what would happen to the trendline of the last bust if we applied the C-S methodology of comparing house-to-house trends in place of unadjusted medians?
In other words, I wonder how much of the mini-rallies that occurred during that time period were the result of renewed activity overall vs. renewed activity at the high price ranges?
It’s an idle question: I can’t think of any way to do that going so far back in time without buying all the data for those years from Dataquick. Even then, without MLS listings to fill in the blanks on individual properties it would be hard to reliably identify the different attributes.
I agree bugs… That is the
I agree bugs… That is the problem – we aren’t really seeing apples to apples data. And the data we do see is time-lagging. We see self reported data (and lagging data) on sales which occurred, but not data on how the houses compare.
As I have been looking (lurking) and finally decided to stay renting (as I have been since December) – I can’t justify buying a house right now. The only houses I would consider would have to be perfect. I think that a good number of the houses which actually are selling have little or no flaws (in other words good values relative to similar houses at the same price (even if it is a wildly inflated price).
During the crazy run up people bought anything even with terrible flaws because the better the house, the steeper the premium… Now on the way down, the vast majority of houses have some flaws and this makes them unsellable in a market where the buyers are spooked.
We will still have sales of really excellent properties, and even if prices keep going down they are a relatively good deal compared to buying a problem house at similar money.
This is why the data is so flawed. We are only seeing the houses which are selling. Not the ones which are sitting on the market, or have been withdrawn from the market. It’s only the first round – the pressure is there and will only go downwards.
Bugs,
Historical
Bugs,
Historical Case-Shiller data is available on the Chicago Mercantile Exchange website, http://www.cbe.com. follow the links products-real estate-historical price data.
Case-Shiller forms the basis for the traded options and futures contracts, which project about a 4% fall in SD in the next year.
Case-Shiller is the best index although it does have flaws:
1) Timeliness – the March numbers released in June reflect transactions negotiated primarily January/Febraury.
2) No adjustment is made for improvements/depreciation
3) Index reflects sale prices. In boom times selling and closing costs tend to be borne more by the buyer, in hard times by the seller
All other indexes have more flaws, although they may be produced more timely.
correction,
correction,
http://www.cme.com
sorry about that!
Im curious how Case-Shiller
Im curious how Case-Shiller compares against the govts OFHEO index which according to the latest report shows that home prices have risen in the first quarter of 07. does anyone have any input or rebuttal? Just curious.
http://money.cnn.com/2007/05/31/real_estate/agency_home_price_up/index.htm?postversion=2007053115
I believe that the OFHEO is
I believe that the OFHEO is based on purchases and refinancing of homes that fall within the conforming loan limits of Fannie Mae and Freddie Mac. This would leave out a large chunk of the homes sold in southern CA.
Yes that is true, I guess
Yes that is true, I guess it’s just another way of trying to keep the coolaid flowing.
OFHEO,subprime,jumbo
Everyone
OFHEO,subprime,jumbo
Everyone points to OFHEO numbers excluding the jumbo loan properties, and implies that this might be the primary reason for a discrepancy between OFHEO and Case Shiller indices. But there is another difference that I suspect is even more important, to which Rich’s post alludes. Since Fannie and Freddie don’t buy many subprime loans, the OFHEO numbers would seriously underweight subprime heavy neighborhoods, but the Case-Shiller index would catch those. If subprime heavy neighborhoods are falling faster than other neighborhoods, than OFHEO will understate the decline relative to Case-Shiller.
Thanks, Rich, for posting
Thanks, Rich, for posting this. I like this article because (and even more, the graph) because it so clearly demonstrates the weakness of Median Price as an indicator of market strength.