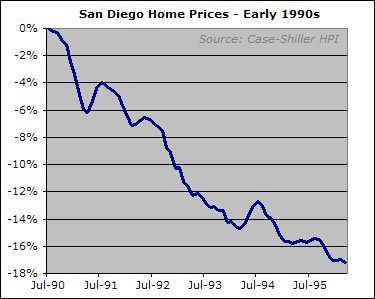
In my recent January home price data roundup, I included a graph of home prices during the early-1990s bust to illustrate that bouts of price strength were common even during a protracted downturn. A smart reader pointed out that mini-rallies were more than just common — they were to be expected as part of the seasonal price cycle.
It’s meaningful if you sell
It’s meaningful if you sell a house during s rally (whether or not it’s sustainable)
[img_assist|nid=2685|title=|desc=|link=node|align=left|width=466|height=372]
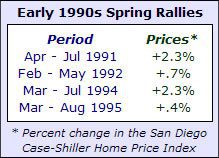
Most of these rallies are in
Most of these rallies are in the traditional spring/summer season and reflect the seasonal cycle. 1993 was the only year in the last downturn without at least a noticable change in slope or nice bump for fluffy the cat to ride on. In all cases they weren’t bad spots to sell Nice points to sell.
Anx – Nice graphic. But should the cat be talking if it is dead ?
The psychology of housing
The psychology of housing rallies
The psychology of rallies in housing is similar to stocks, except the imperative to buy a house is greater. When prices cool, pent-up demand from buyers unable to afford at higher prices comes into play, and they jump into the market, believing prices won’t cool any more. Once that pool of buyers is exhausted, prices continue to descend, with another mini-rally as the next tier of purchasers is reached. So you will get a succession of dead kitten bounces, or ‘falling knife catchers’ all the way down. Note that many home purchasers are not seeking to profit from discretionary income, unlike the stock market, they are simply trying to put an affordable roof over their heads which they have some control over, and secure some basic equity for their retirement.
Housing activity (#sales)
Housing activity (#sales) has a strong seasonal component. The stock market does not have as strong a seasonal component as housing does. I would contend that the rallies in the stock market are more classic “technical” bounces as you describe than for housing. The housing bounces are more predictable. Even real estate agents know when they are going to happen.
Nice graphic. But should the
Nice graphic. But should the cat be talking if it is dead?
Thanks.. maybe not, but if you know of someone with a talking live cat I’d be interested in meeting it.
Anx, nice additon. Maybe
Anx, nice additon. Maybe the cat should be saying, “MEW” instead of “Meow.” It could also cough up a hairball with a “HELOC.” 🙂
Nice graph!
How do we
Nice graph!
How do we explain the difference between Case-Shiller -15% and Dataquick +1.1% over that time period? (Case-Shiller went from 86.02 to 72.63, Dataquick from $168.8K to $170.9K).
I just checked Dataquick median prices and found the median price in San Diego jumped up and down for 7 years, basically staying flat from Dec 89 – Dec 96 at $162 – 175 K.
The mini ups occured at any time of year, even in fall. For example, from Oct 90 – Dec 90 +5%, Oct-Dec 93 +4.3%, etc. Basically, nothing goes up or down in a straight line, so it’s definitely normal for any asset to have some counter trends within a cyclical larger trend.
That said, the strong rally will show up in higher March sales, which is seasonal.
Powayseller, you already
Powayseller, you already know why Case-Shiller shows a decline and DQ doesn’t.
Case-Shiller measures using same home sales resale data.
DQ measures median of whatever is selling. It has no correction for a growth in house size or a declining market’s ability to buy a nice SFR for $500,000 instead of a cruddy condo conversion.