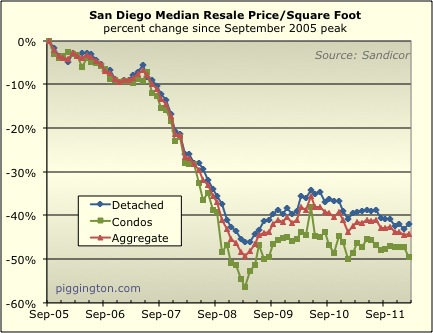
The median price per square foot was mixed last month, with single
family homes up 2.0% but condos walloped for 4.3%. In
aggregate, prices by this measure were mildly up simply because a
lot more single family homes than condos sell each month. In
any case, the single family series tends to be smoother and a more
reliable indicator of what’s really going on, so I’d say February
was a mild win (or at least a tie) for prices:
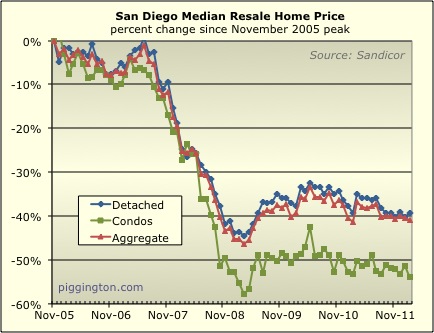
The plain vanilla median exhibited a similar pattern:
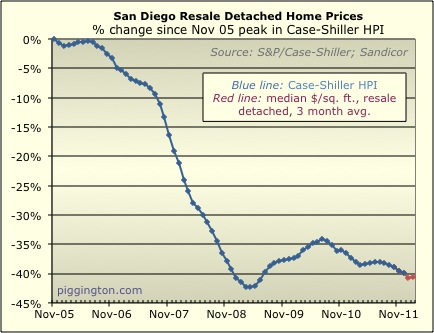
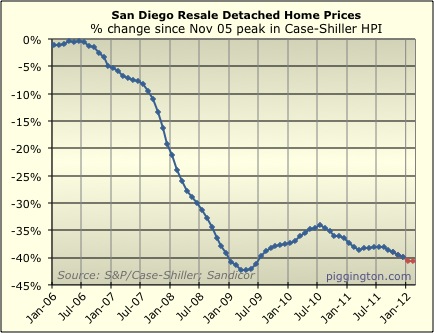
The proxy for future Case-Shiller index releases, calculated (as is
the CS index) based on detached home prices, nudged up by .2% for
the month:
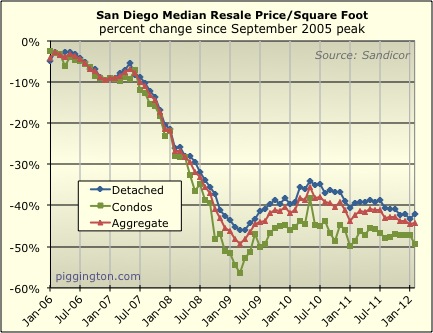
Here are the median price per square foot and Case-Shiller proxy
graphs aligned with the calendar years for purposes of spotting
seasonal patterns:
The number of closed sales was slightly down, which is better than
usual for recent Februaries:
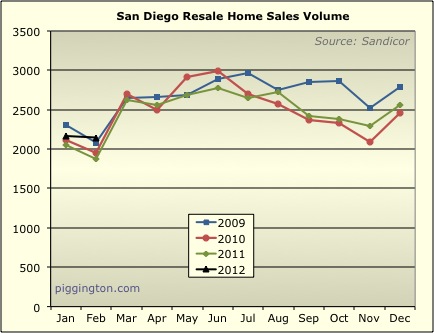
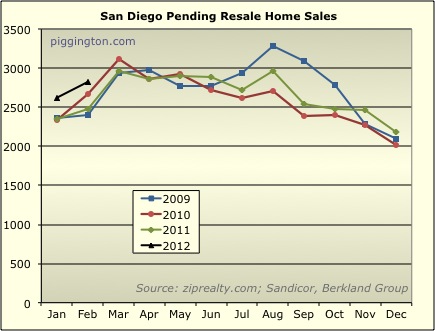
Pending sales were up buy a pretty typical amount month to
month. Note that both closed and pending sales (especially the
latter) were higher than in any of the past three years):
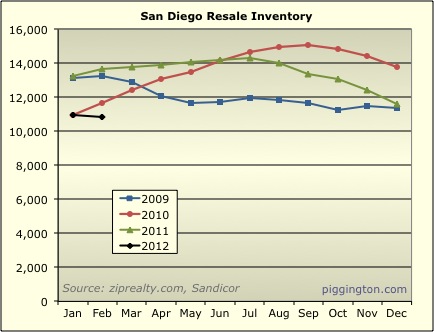
Now here’s where it gets interesting. Inventory was actually
down for the month, something that has not happened in recent
Februaries. The number of homes for sale was down 20.5% from a
year ago:
But that decline masks the actual tightness of inventory to some
degree, because an increasingly large percentage of inventory is
“contingent”:
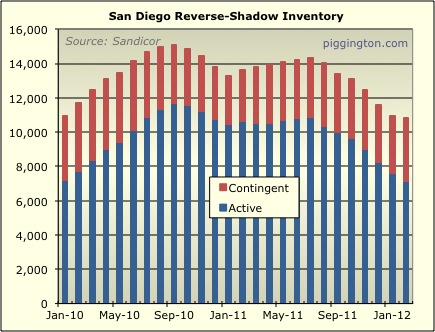
To review, contingent inventory primarily consists of short sales or
bank-owned properties on which an offer has been accepted, but not
all terms have been approved by the lender. While the deal is
not closed, and may not close (ie, the property may end up back on
the market), a contingent property is effectively off the market
while it’s contingent. Our own urbanrealtor wrote all
about this a while back in this
voiceofsandiego.org piece, for those who’d like more
background.
When we pull out contingent properties and look only at “active”
inventory, we see that actives are a full 33% below where they were
a year ago:
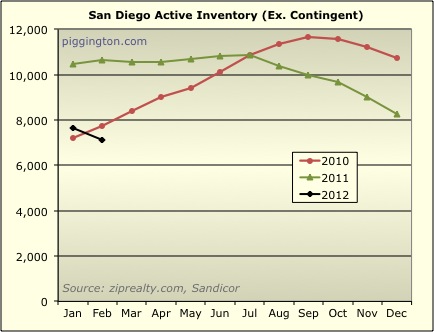
The MLS didn’t start separating out contingents until mid-2009, so
unfortunately we lack the historical data to do longer term
comparisons. So I use overall inventory for my “months of
inventory” number. But I think it’s good to keep an eye on how
much is active vs. contingent. In this case, we know that if
anything, overall inventory numbers are currently giving the
impression that supply is less tight than it actually is.
Even considering that, the overall inventory numbers look very
tight:
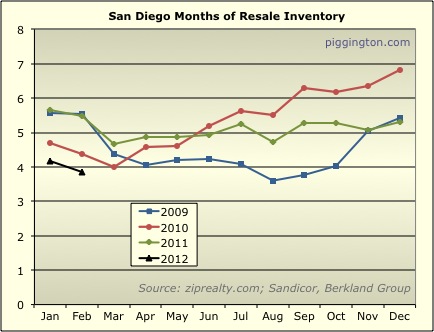
Months of inventory cracked through the 4-month barrier to 3.8
months. This is a very low level of supply compared to recent
history.
Here’s an old graph I just updated for voiceofsandiego.org shows
that there has been a correlation between months of inventory and
price changes. (Thanks again to Calculated Risk for the
inspiration on this graph). Here’s how the graph works: the
blue line is months of inventory, but it is inverted so that it
moves directionally with prices (this is necessary because lower
inventory correlates to higher price changes). The red line is
the annualized monthly change in prices (per the Case-Shiller index
and then my proxy of same for the most recent two months).

You can see that the correlation has been pretty good. The
series have tended to move directionally together, and there has
also been a general tendency for prices to increase when months of
inventory was under 6 (the thick black line), and to decrease when
inventory was over 6 months.
The relationship has only really broken down twice over this time
period. The first was in late 2008 and early 2009 when
inventory got a lot tighter, but prices continued to plummet.
I had theorized that this was due to the generalized doom and
uncertainty of the financial crisis overwhelming shorter-term
inventory considerations. Note that price growth made a big
catch-up move to the upside once the crisis phase was over.
The second (less dramatic) breakdown has been the period since
mid-2011. Despite inventory hanging in at under 6 months,
prices have been steadily declining. If I had to guess, I’d
say that the preponderance of foreclosures and short sales is
keeping prices lower than they otherwise would be at similar levels
of supply. Even still, the Case-Shiller proxy shows that price
changes may have at least turned positive as a result of this latest
decline in inventory.
One last observation on this chart: prior to the current period,
during those infrequent times when inventory was at or below 4
months, prices have always been rising (and usually pretty
fast). And foreclosures were a big issue back then, too.
These inventory levels say nothing about the longer-term prospects
for housing, nor about exogenous factors that could come into play
and change the supply/demand picture (abruptly higher rates being a
favorite example). But they do tell us about price pressures
in the months ahead. The current rather dramatic tightness in
supply is hinting that the price pressure could be to the upside.
I take exception to your last
I take exception to your last chart of correlation between changes in sales prices and months inventory. You are comparing second-order changes (percentage change in prices – red line) to first-order changes (months supply of inventory – blue line). If you compare first order changes to first order changes you will get a radically different chart.
Take a look around mid-year 2009. Does everybody see the blue line go from 4 months to 6 months over a span of two months? That is a 50% increase in the second-order movement. Had you charted the second-order movement of inventory, just like he did with sales prices, the blue line would be down at the bottom of the chart while the red-line would still be in positive territory. This is a case where you compared apples to oranges and ended up with a banana smoothie.
Since you obviously have the raw data to create the charts. Why don’t you just run the correlation coefficient over the entire period and report it to us? But it has to correlate sales prices (not CHANGE in sales prices) to months inventory. Just eyeballing your chart, it looks like since the home purchase credit ended in 2009, sales prices and months inventory are negatively correlated…a bad omen of things to come.
I don’t see why that (first
I don’t see why that (first order vs second order) is a problem. Putting it English, the premise is: when supply is low, prices tend to increase; when supply is high prices tend to decrease.
Yes, I’m comparing a level (of inventory) with a rate of change (of prices)… but why is that a problem? Once translated to English, as in the prior paragraph, it’s an entirely reasonable way of looking at things.
Just for giggles, I ran the correlation you asked. The correlation between months of inventory and price LEVELS is .44. That’s positive .44, ie, higher inventory has been correlated with HIGHER price levels. This is an artifact of the large decline in prices over this time (ie, prices are lower now than they were in 2007 when inventory was much higher). So that’s actually not a good way to look at it at all.
On the other hand, the correlation between months of inventory and the RATE OF CHANGE of prices is -.63. So, these two series are negatively correlated as I have suggested. (And, for reasons described just above, it makes sense that they should be).
Good charts and logical
Good charts and logical explanations, but upward price pressure due to lack of inventory assumes consistent demand. If there’s one complaint I hear more often among buyers than anything else, it’s lack of inventory. If buyers aren’t seeing the choice many will stay on the sidelines. So I think the chances of a continued stand off (stagnation/decline), are as equally likely.
Jazzman, months of inventory
Jazzman, months of inventory measures demand — it’s the amount of supply divided by the number of pending sales in a month. So there is no assumption being made of constant demand… demand is accounted for in the measurement.
How is the demand element of
How is the demand element of inventory a prediction of future demand?
Jazzman wrote:How is the
[quote=Jazzman]How is the demand element of inventory a prediction of future demand?[/quote]
It isn’t. It is a snapshot of current demand.
Anyone know of a method to accurately predict future demand ?
Household formation ? Job statistics ? Hourly wages ? Phases of the moon ?
Jazzman wrote:How is the
[quote=Jazzman]How is the demand element of inventory a prediction of future demand?[/quote]
Ah, I see what you mean… I misunderstood your original post. You are saying that the lack of choices could itself reduce demand, driving months of inventory back up. I suppose it’s possible… it’s definitely the case that months of inventory haven’t remained this low for long, in the recent past. Perhaps that’s one reason why.
I think Rich is right on
I think Rich is right on this.
Because months of supply implies upward or downward pressure on prices, months of supply should be compared to whether or not the prices increase or decrease. Don’t let the math get in the way of logic.
I’m wondering if you do a correlation of months of supply vs the price change one or two months later if you wouldn’t get an even higher (negative) correlation.
All I know is it is getting
All I know is it is getting really tough to get offers accepted out there. I have submitted several very fair to seller $400K all cash offers on houses in Mira Mesa and dont even get calls back.
FWIW, I didnt see any way prices could increase for another few years. I am talking about real increases in nominal prices and not secular/seasonal variation. I am quickly abandoning that belief. You can come up with all the reasons why including shadow inventory. It still doesnt change what is happening on the streets.
There are always going to be
There are always going to be buyers that will pay anything for anything, but there is a common perception among many buyers that home values are still too high, and inventory too low to bother looking seriously. So I guess these two contrary forces will continue to battle it out in much the same way as they have over the last few years. I just wouldn’t put my money on price increases winning out in the near term. I believe a shrinking inventory will shrink the buyer pool by the same amount.
Jazzman that common
Jazzman that common perception is among some but not all buyers. There are multiple buyers out there for everything out there. I have been writing cash offers for a couple weeks in Mira Mesa and not getting close. These are all cash offers at current comps. With interest rates rising buyers start getting very nervous. This creates a sense of urgency that they need to get in before they go even higher and voila!!! We get higher prices.
You can beleive what you want and it makes perfect sense what you propose. It just plays out differently on the streets. This is one of the few things in the last several years I didnt think would happen but my views are quickly changing based upon what is happening out here.
Sdr, I do make it clear (I
Sdr, I do make it clear (I hope) this is not everyone. In fact, it might even be a minority. BTW I’m hearing an increase in noise from buyers being outbid by cash buyers recently. Same story as a while back. What does the word on the street say? What rationale for a sudden rush of investors? Fear of rate change, or just a delayed response to “now is a great time to buy”?
Jazz
I think its a
Jazz
I think its a combination of a belief that prices are at or near a bottom, CD rates suck, stocks are too risky, the economy is starting to improve and rents have risen alot. Throw that all in a pot and RE looks pretty good to conservative investors.
FWIW I dont think prices are going to skyrocket but the combination of a 5% increase and a little bump in interest rates quickly starts feeling like a 20% jump to buyers.
ex. $400K house goes to $420K (5% more). With 20% down you need $4K more down (5% more). Rates just went from 3.75 to 4% this week and could easily get to 4.5% (again I think they will go back to 3.75% but who knows?). That would increase the monthly payment by 15%. Throw that all together and a buyer would feel like they missed out on a better deal by 20%. Fear of this happening is a powerful motivator and I have seen it take prices up before. Personally I’d rather see more inventory, stable price and, stable rates but I dont get to make the rules.
So demand is really hot at
So demand is really hot at the bottom of the market pricing, $400k, how many on this board want to sell their home for $400k?
You need to address that
You need to address that question to people whose houses are worth $350k now for it to be relevant
Then you need to start giving
Then you need to start giving relevant examples of offers for prices that the people on this board paid for their homes, I doubt anybody paid anywhere near $400k.
desmond wrote:Then you need
[quote=desmond]Then you need to start giving relevant examples of offers for prices that the people on this board paid for their homes, I doubt anybody paid anywhere near $400k.[/quote]
Really?
desmond wrote:So demand is
[quote=desmond]So demand is really hot at the bottom of the market pricing, $400k, how many on this board want to sell their home for $400k?[/quote]
if you have 400K, I’ve got one for ya!
Maybe I am missing something,
Maybe I am missing something, but why would all cash buyers care about rising interest rates?
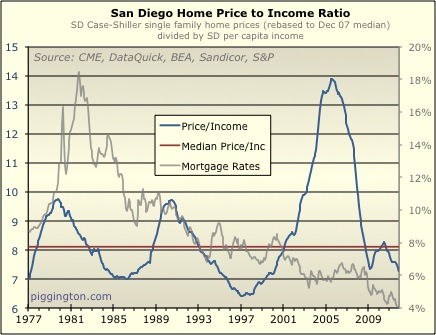
The situation is that the average price to income ratio is still higher than historical averages for most of the coastal California areas; non-coastal areas have come back in line for the most part as have many other parts of the country so housing is more affordable. I think we need to see those become more in line before we can say there we are at a bottom, however, CA is the land of fantasy so current owners will hold out as long as they think they can using every rationalization that is available. But the lack of the easy financing will win out over time.
The government seems to have succeeded at providing a softer landing than an all out crash; at least in most parts of California.
bcumbers wrote:The government
[quote=bcumbers]The government seems to have succeeded at providing a softer landing than an all out crash.[/quote]
HAHAHAHA. I’m looking at the graphs during the 2008 phase and finding this comment completely ridiculous.
bcumbers wrote:Maybe I am
[quote=bcumbers]Maybe I am missing something, but why would all cash buyers care about rising interest rates?[/quote]They don’t, but majority of buyers are not cash buyers.
[quote=bcumbers]The situation is that the average price to income ratio is still higher than historical averages for most of the coastal California areas[/quote]Let me help you out. Here’s the chart of the historical price to income:
[quote=bcumbers]The government seems to have succeeded at providing a softer landing than an all out crash; at least in most parts of California.[/quote]Really? So 50% drop over 2-3 years is not an all out crash?
sdduuuude wrote:I think Rich
[quote=sdduuuude]I think Rich is right on this.
Because months of supply implies upward or downward pressure on prices, months of supply should be compared to whether or not the prices increase or decrease. Don’t let the math get in the way of logic.
I’m wondering if you do a correlation of months of supply vs the price change one or two months later if you wouldn’t get an even higher (negative) correlation.[/quote]
Great idea — you are right.
Correlation since 1/2006 between months of inventory (based on pending sales) and:
– price change same month: -.63
– price change one month later -.72
– price change two months later -.77
Then it starts to go down again after that.