Here, without much in the way of exposition, are some charts of the San Diego Case-Shiller data for August. The first three charts display nominal prices; the latter three display prices adjusted for inflation as measured by the CPI.
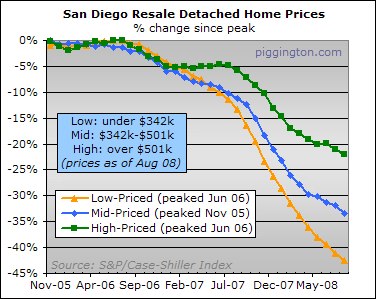
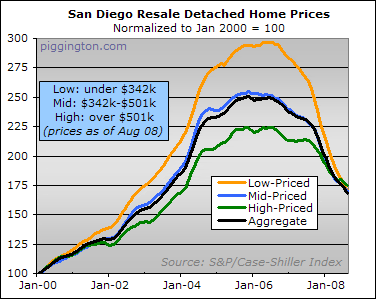
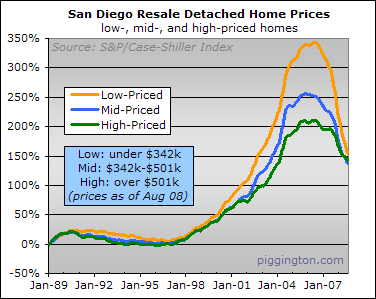
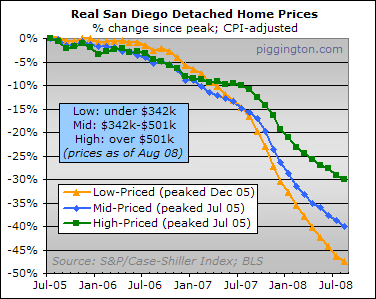
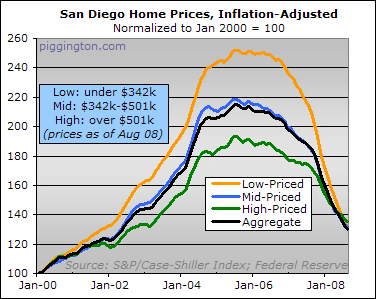
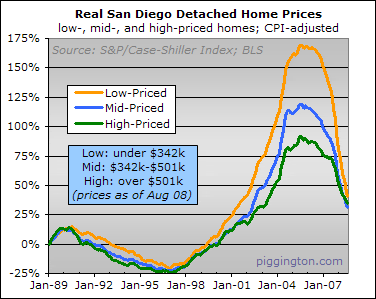
Remember, this is the August HPI figure, which is calculated using data from June, July, and August — so the numbers are more representative of July than anything else. I will have an update of the projected HPI for October within a week or so; in the meantime the September projection can be found in the latest data rodeo.

Wow. Based on those charts
Wow. Based on those charts it looks like we might be near-ish the long-term trendline. Am I missing something?
While the lower-end homes are definitely near traditional levels of affordability (without a recession), the high-end just seems way out-of-whack, IMHO.
Thanks for the graphs, Rich!
It may be close, but it will
It may be close, but it will almost definately overshoot it. As Rich said these are based more on July when things overall were better than they are today.
Given the economy today – credit/lending, confidence, unemployment – think about where the path of those lines will go: up, down, flat?
Me thinks down.
With the so called “bailout”,
With the so called “bailout”, it will down at least 4 more years. Without the “bailout”, it will down probably 1.5 years.
Also have to remember that
Also have to remember that many pockets of town have not depreciated very much, or at least not as much as the aggregate.
I have to say the coast has
I have to say the coast has been resistant. I have seen some impressive declines along the coast, but only condos, the weakest link. There’s been some NODs and foreclosures on some homes along the coast, but the banks are not reducing greatly on SFH
Is there a way to see C/S
Is there a way to see C/S sectored out by zip code?
One of our own has done some
One of our own has done some nice work in San Diego in this regard on his blog.
http://sdhpi.blogspot.com/
sdhpi is a start. But zip
sdhpi is a start. But zip codes would be so much more useful as they usually reflect a geographical area that approximates an area as a neighborhood. Especially in the SD City limits.
I wonder if the MLS has enough relevant data for this that’s available? The data is out there somewhere. Like county records,etc…but mining and correlating it could be a real pain.
Individual zip codes are too
Individual zip codes are too small and they often result in noisy c/s charts. Houses don’t sell exactly for what local c/s tells them. Sales prices can deviate 15-20% from the average, especially in non-tract areas. If you only have 5 repeat sales in a zip code in a given month, your ability to identify the average is greatly impaired. SDhpi uses aggregate multi zip code zones out of necessity.
Yes, that’s why I was
Yes, that’s why I was thinking MLS and county records. Mostly MLS data, I guess. Since it’s easier to access. This way I can see the properties and correlate to same square footage and some other somewhat constant comparables. Same house sales is limited as the average ownership is something like 7 to 10 years. Apples-to-apples comparisons is great, but narrow data sets can be very misleading or incomplete. Especially when aggregated over a very large area.
Coop. Those figures are mid
Coop. Those figures are mid July after escrow and about end May for the signature. So they are essentially spring decisions. You can see the seasonality in the chart for the mid and upper prices ranges. So by now, end Oct /early November, FIVE MONTHS later, the spring effect will be out and five months more falls. it might be 8-10% below the end of these graphs as we speak… mid 01 in inflation adjusted terms.