Here’s a fun new chart — months of inventory vs. monthly price change for San Diego houses:
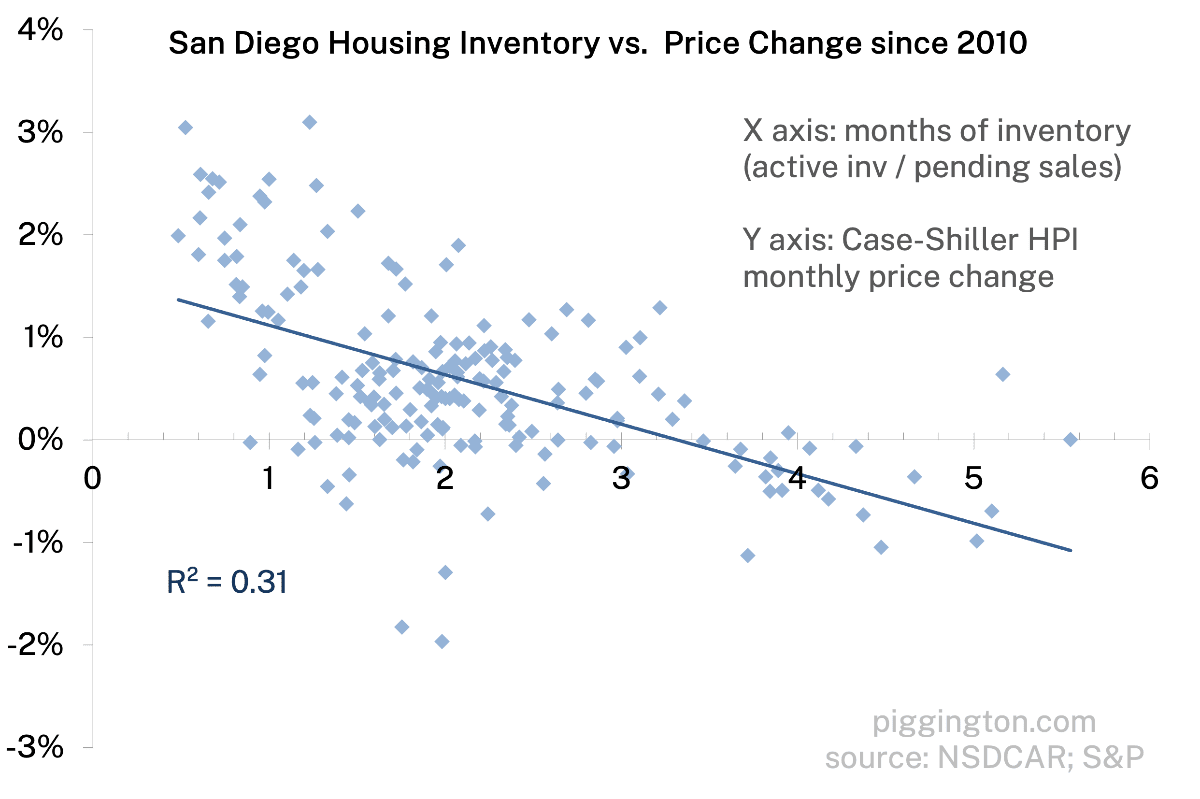
There is a clear relationship here, and it suggests that prices tend to come under pressure starting at about 3.5 months of active inventory.
There is some noise month to month, and it could be that this relationship will be different in the future than it has in the past. But this seems like a decent rule of thumb. (BTW those outliers at the lower left of the chart occurred during 2022, when the interest rate shock — combined with nosebleed valuations — caused prices to decline despite low inventory).
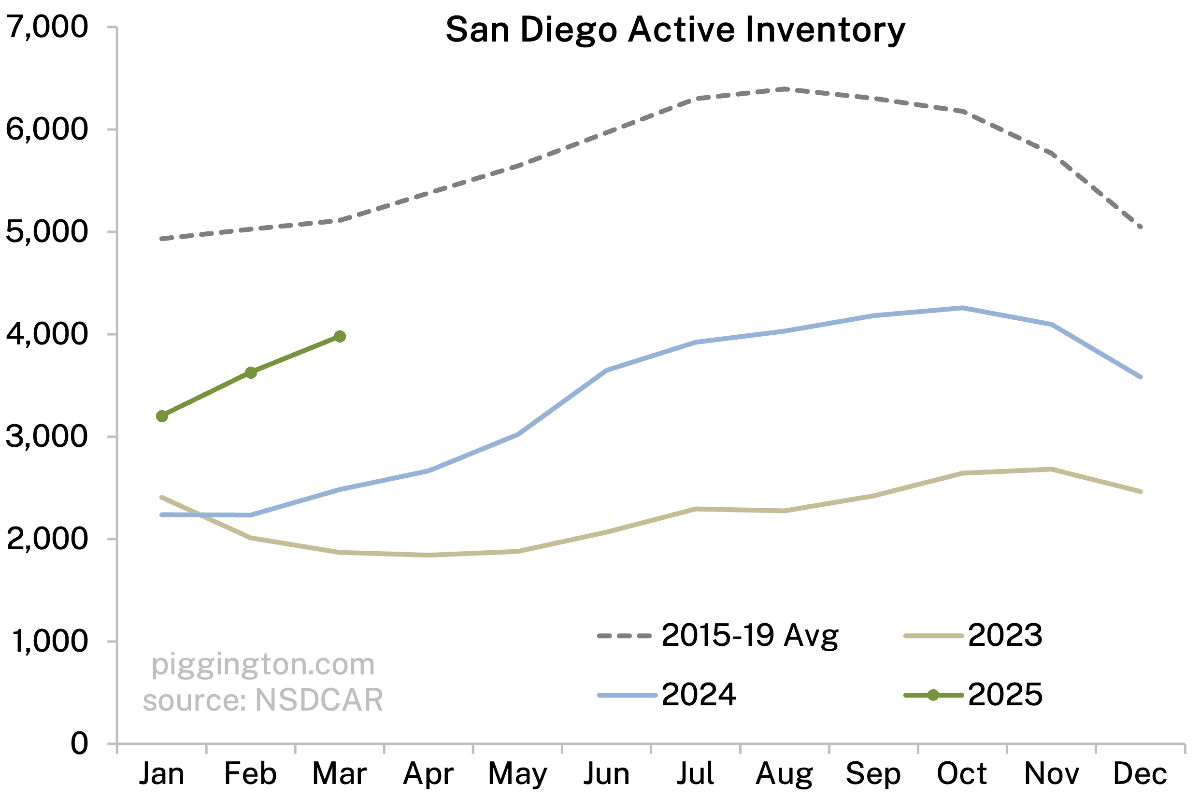
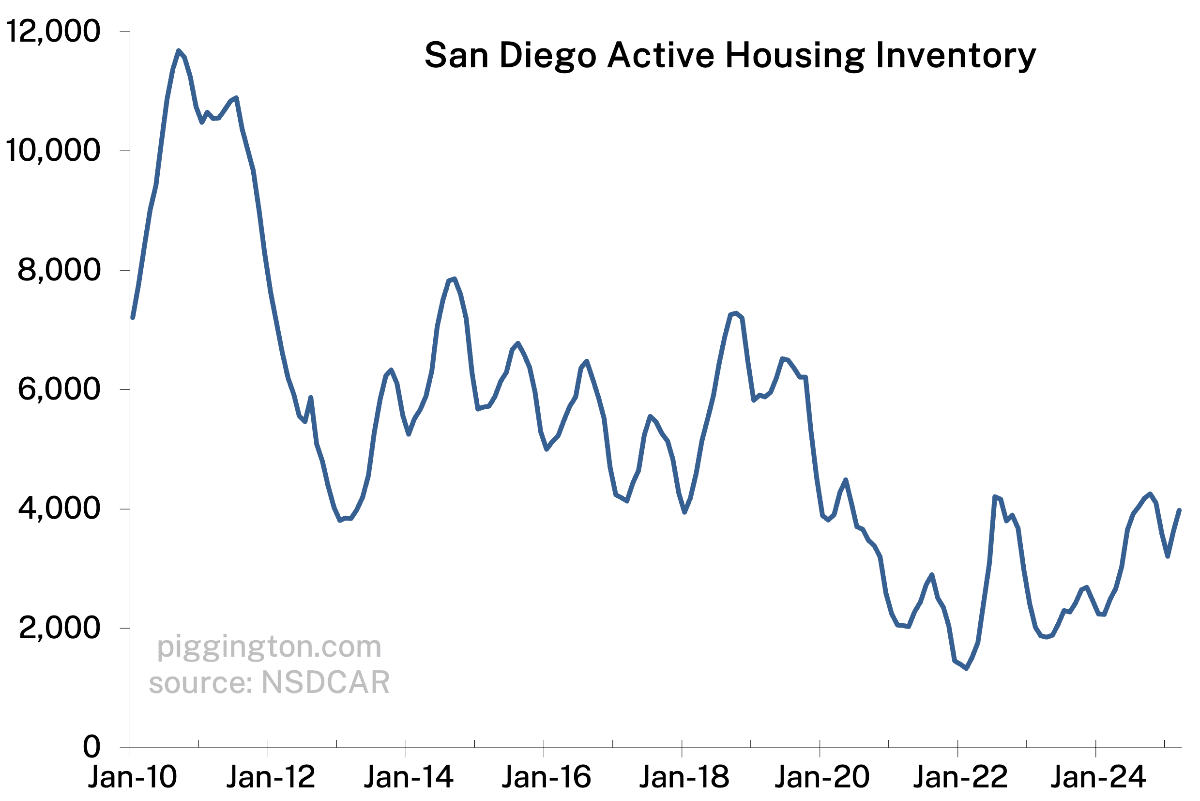
So where are we now? The good news is, we’re nowhere near that 3.5 months level:
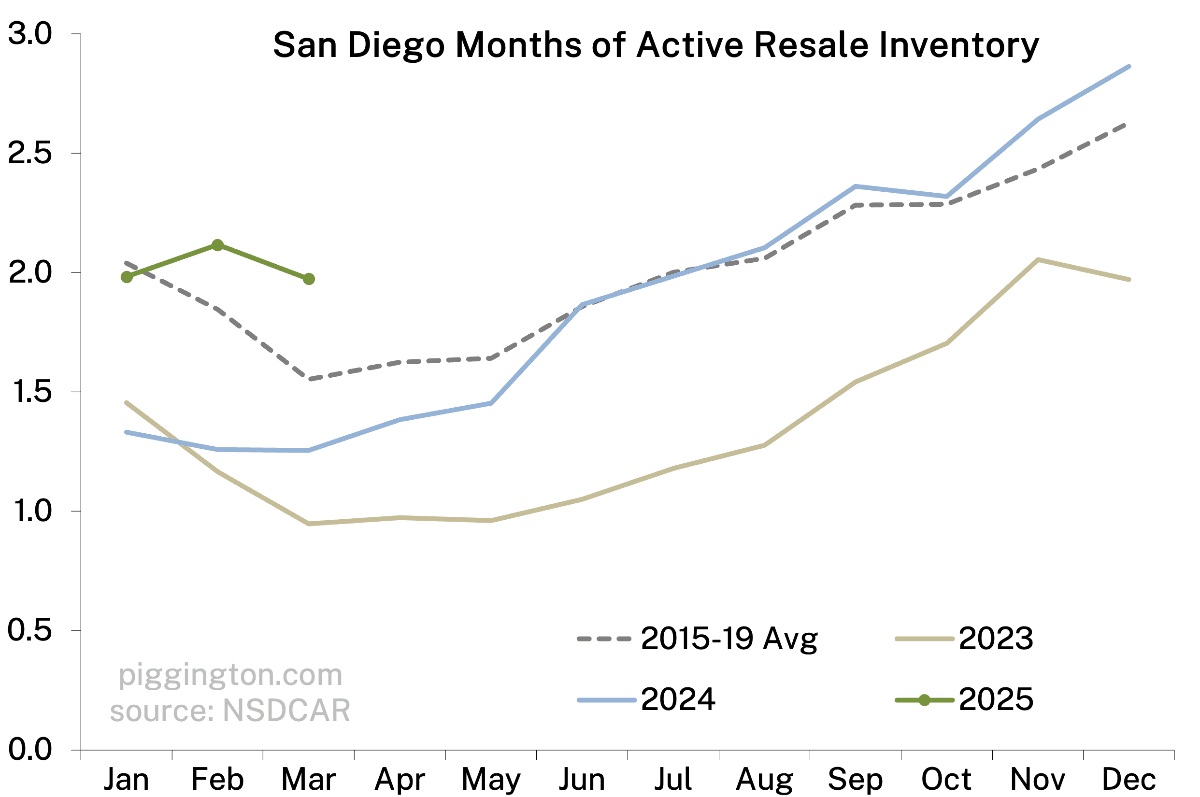
The less-good news is, this number doesn’t look as robust when we consider that March is typically the inventory low-point for the year. March inventory was well above the pre-pandemic average and even further above March 2024. A normal seasonal increase would push us near the price decline zone by year-end; a 2024-sized increase would push us past it.
To summarize inventory: looking ok for now, but unusually weak for this time of year, so let’s see what happens (oh and there are some economic shenanigans underway, maybe you’ve heard about them).
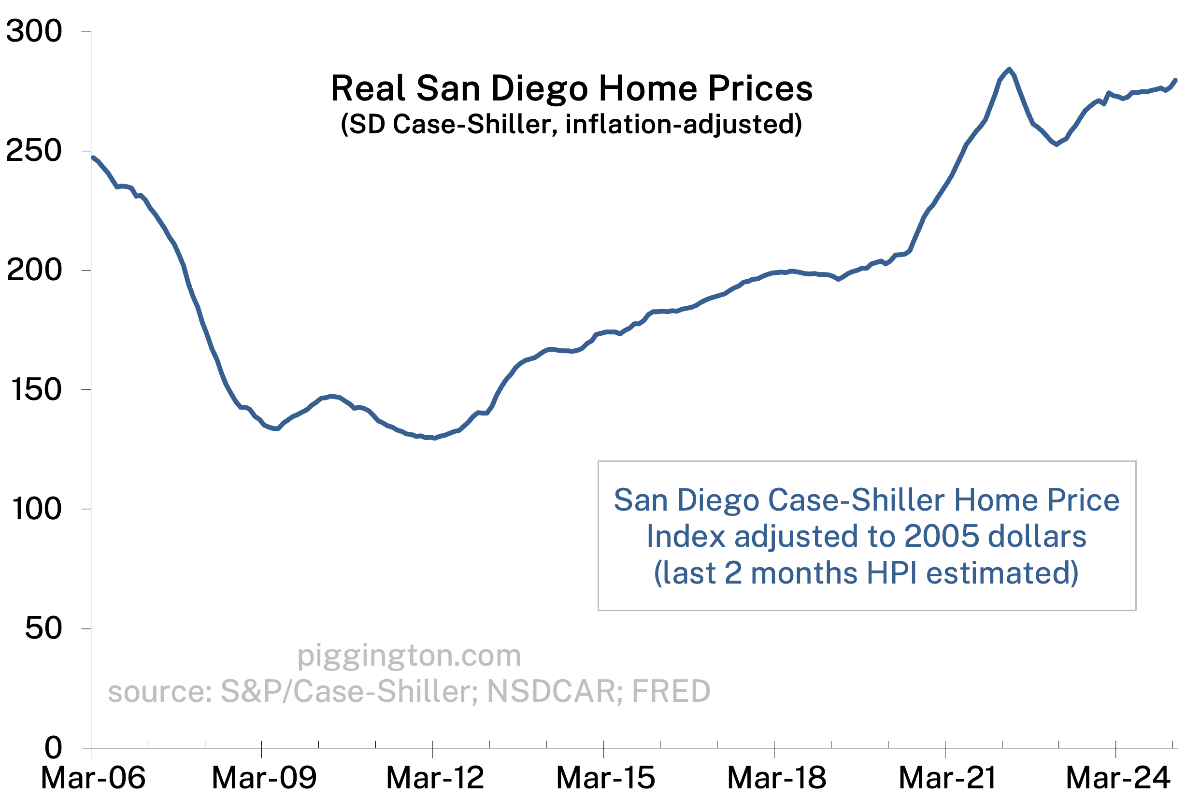
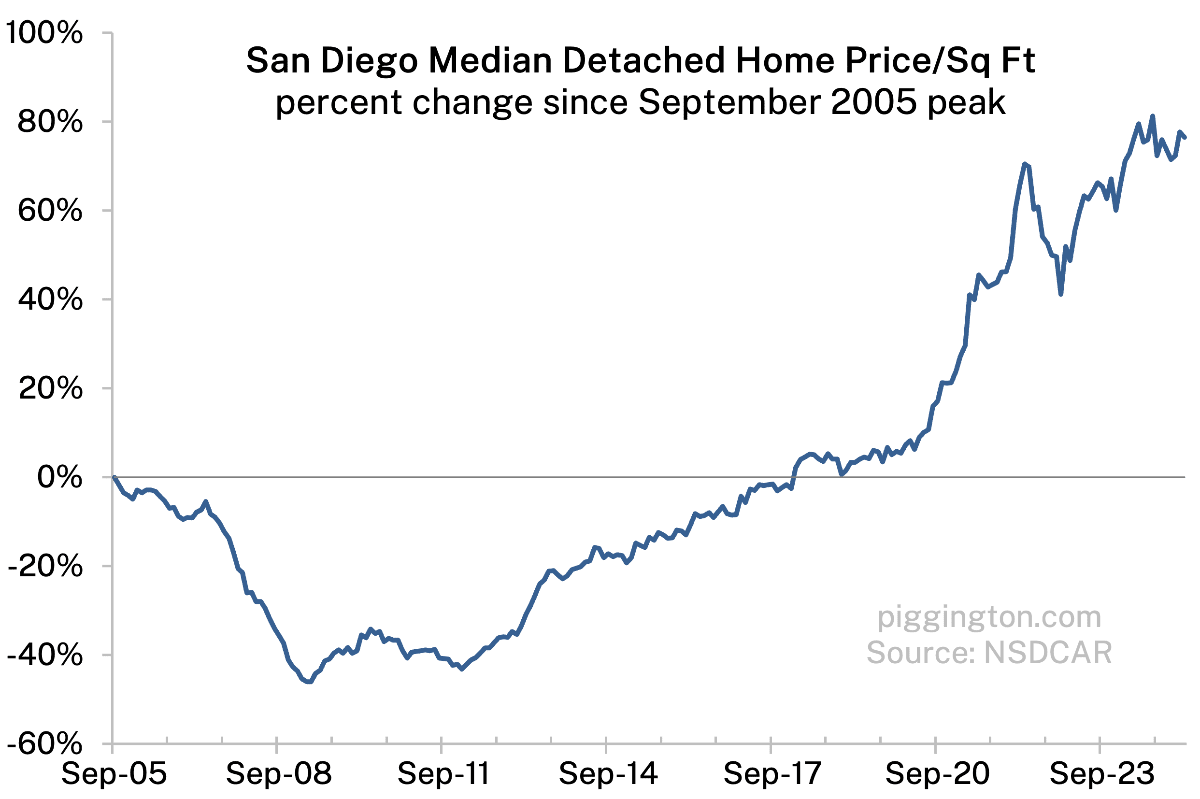
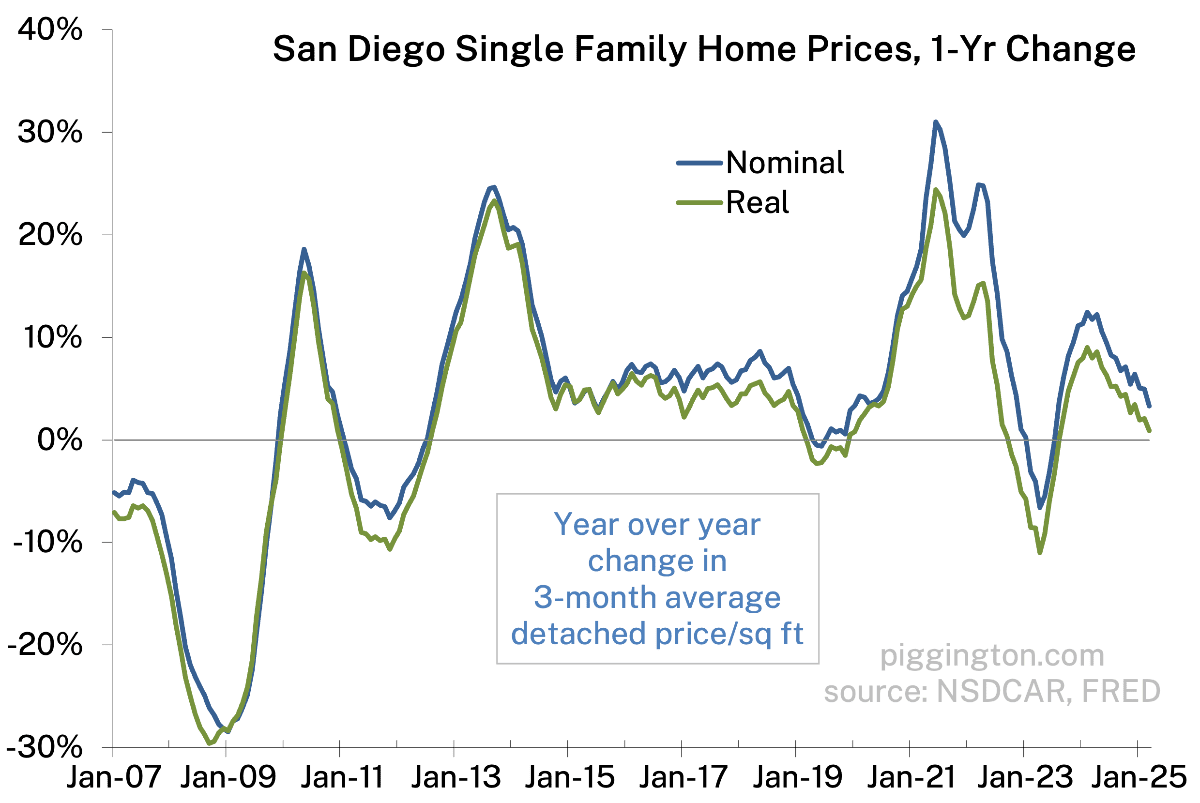
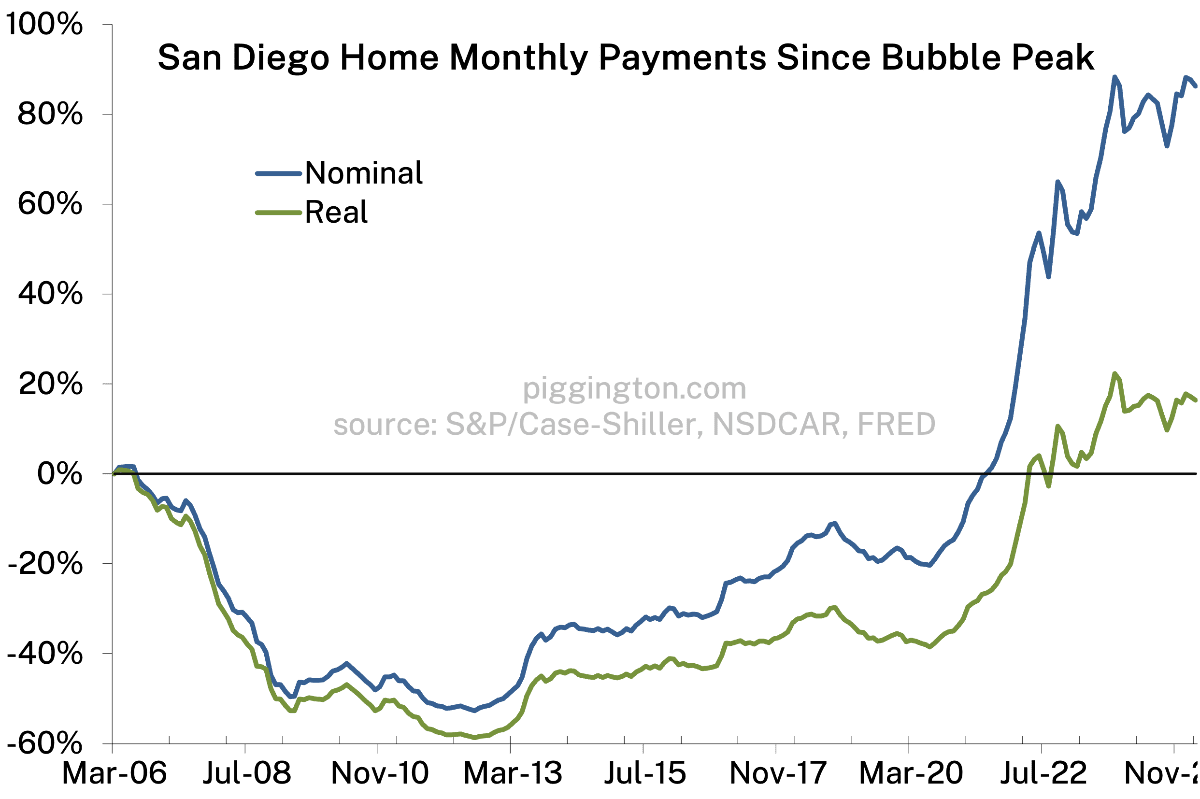
One other graph I’ll emphasize here, since people don’t even believe me when it comes up in conversation. Real home prices are lower than they were 3 years ago:
Those are all the words for this installment; more graphs below.


Every Pigg loves a new chart, thanks Rich!
Sold my Kensington house in March. Listed in January. Didn’t quite get our aspirational listing price but I was happy with the outcome. The market was slower than I expected. Plenty of lookers but quite a while before I got an offer, prompting a second offer to provide a little negotiating leverage. A couple of other neighborhood homes in the same price range have dropped their prices a bit and are still active on the market. Thanks for all the info over the years! I started reading Piggington’s during the crash after the Great Recession. I have had owned 4 San Diego properties over the years and Piggington data was helpful in making those transactions.
Thanks for the color… and happy you have found the site to be helpful!
Tying together your point about the price decline vs 2022, maybe the 3.5 month mark shifts lower as prices go higher, so at these price levels inventory levels in the high 2s, or just touching 3, might be enough for a price decline vs the regression analysis as a secondary overlay variable. Would imply future price increases might bring down the number of months inventory to a lower level for flat to decline.