This chart of months of inventory really caught my eye:
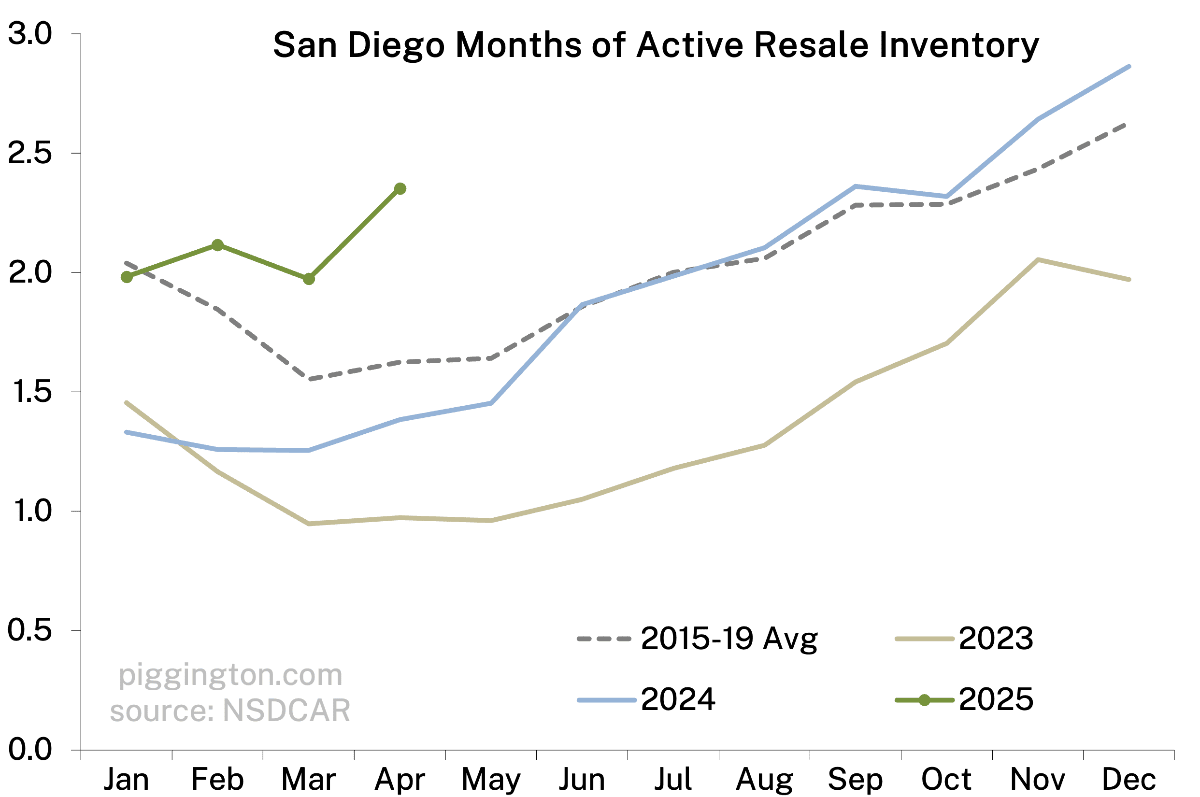
The absolute level of supply (measured as active inventory divided by the pending number of sales last month) is reasonable at about 2.5 months’ worth. However, this is typically the time of year during which inventory is near its lows. That inventory pop in springtime doesn’t look healthy, at first blush.
However, last month’s tariff-driven market panic (seemingly forgotten at this point) may have caused some people to hold off on buying. We may see a rebound in buying in the months to come.
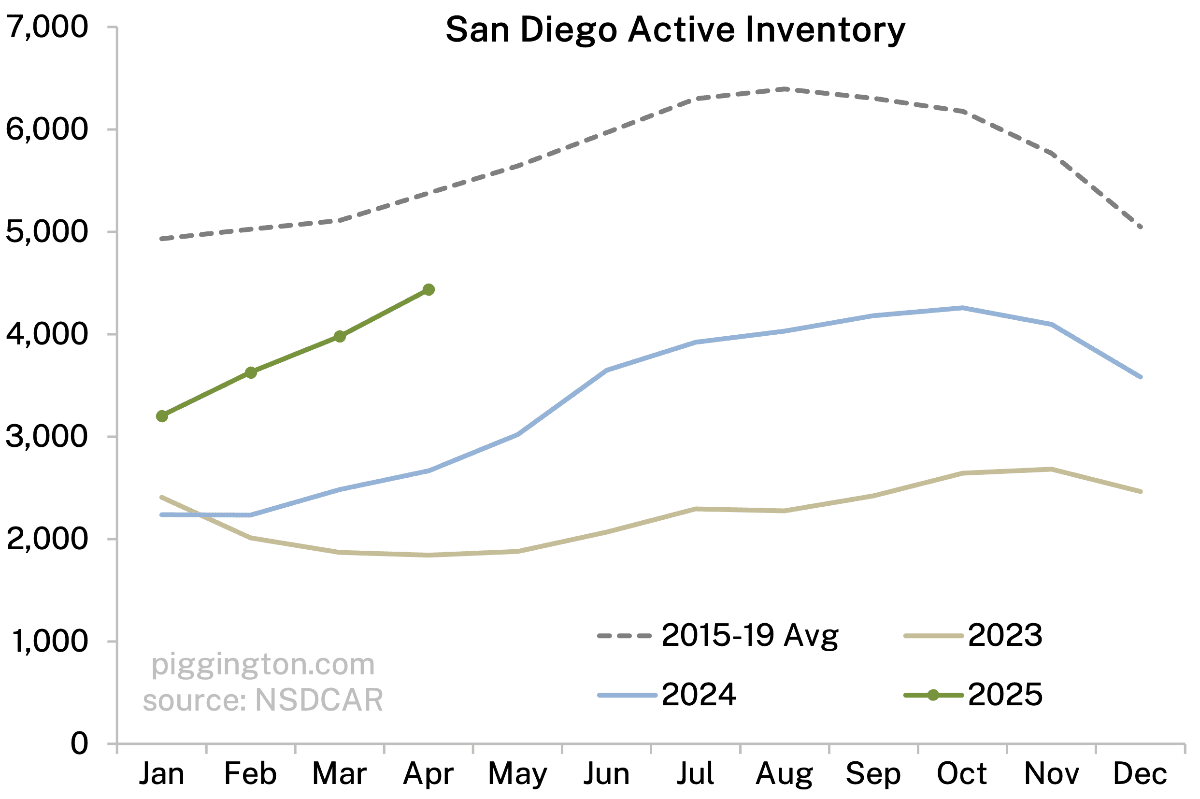
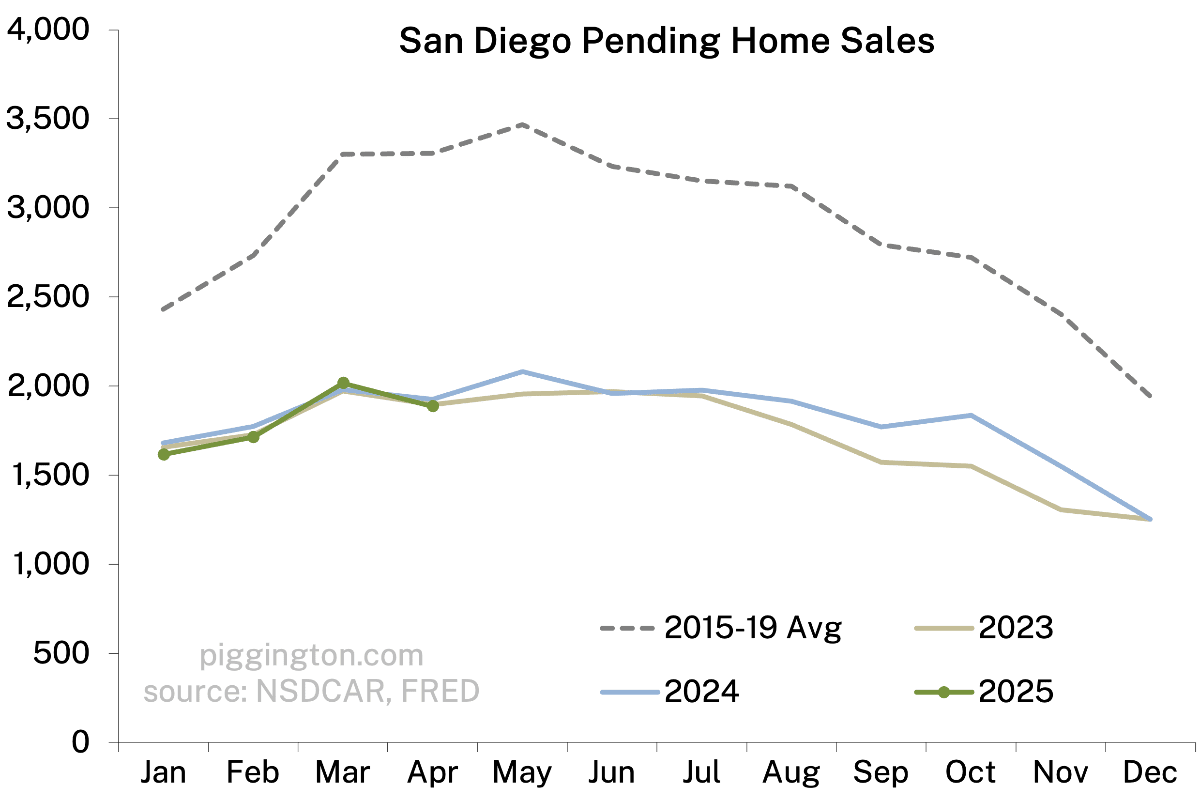
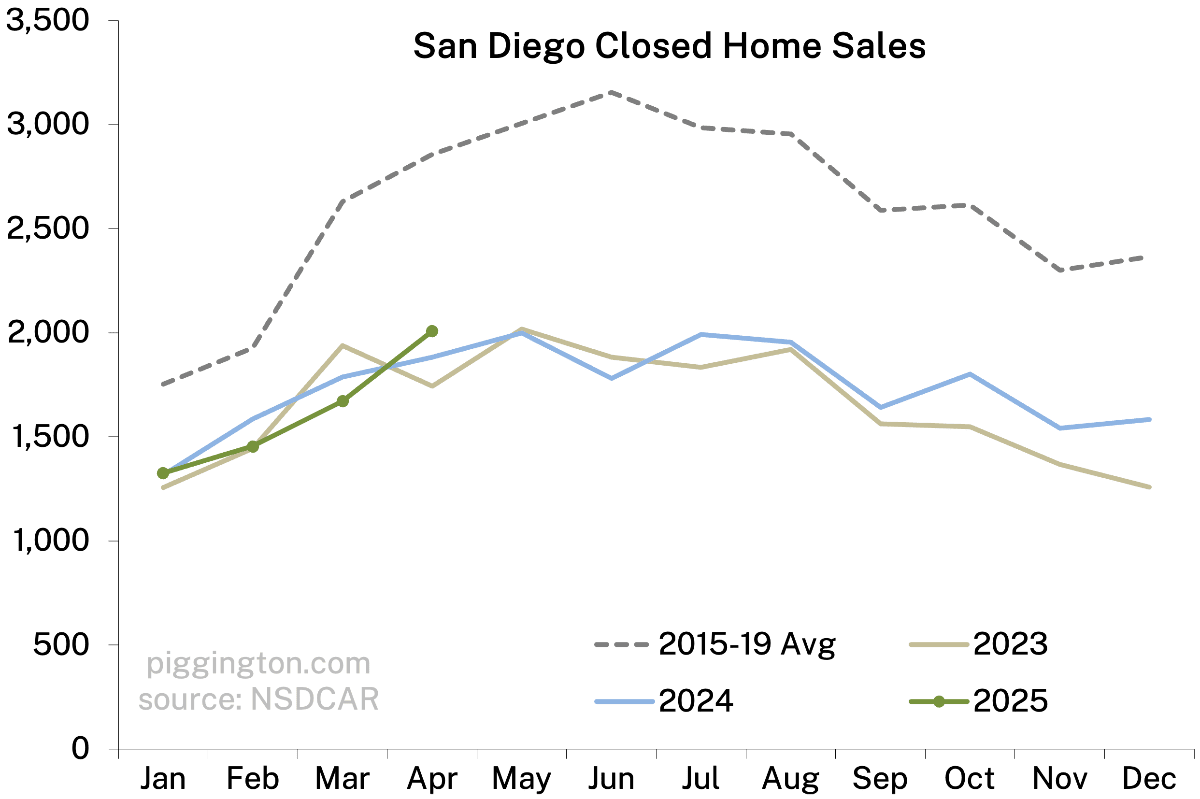
FWIW the pop in months of inventory came from the steady increase in homes for sale, while sales remain near their post-Covid lows:
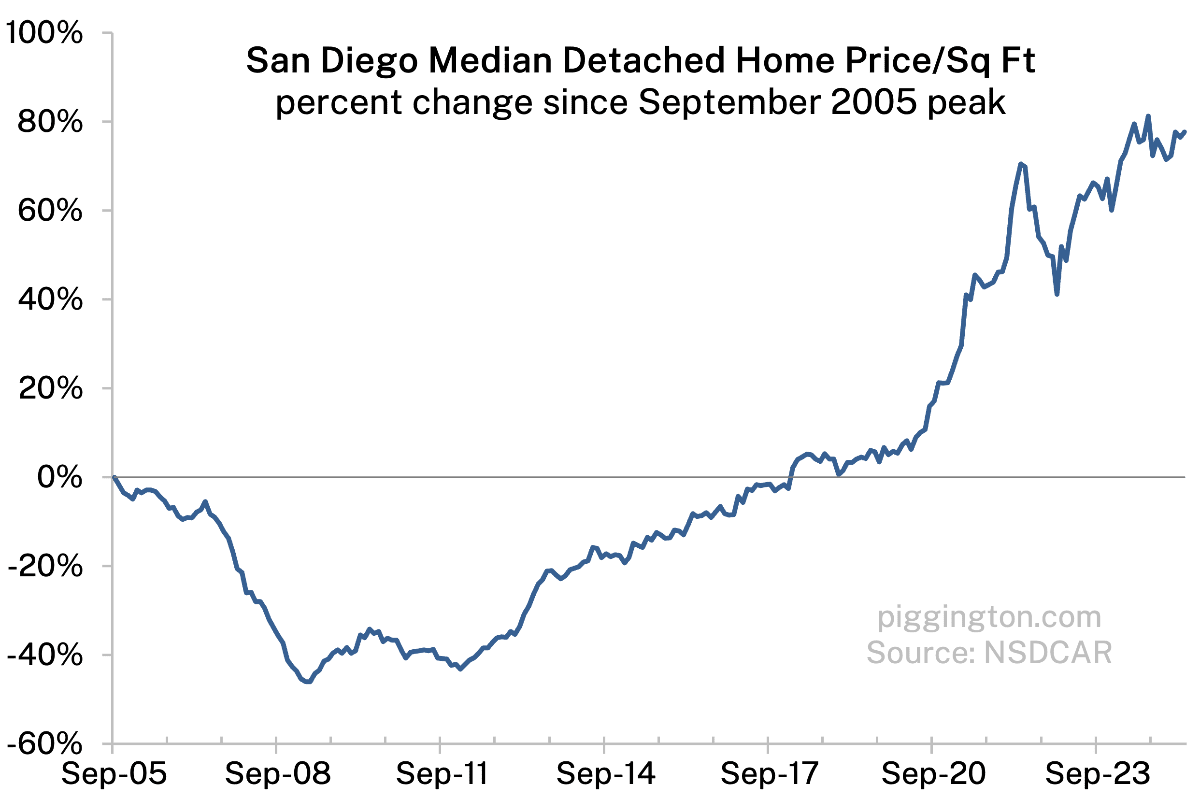
Prices have hung in there, and we are still below the level of inventory at which prices tend to decline. Again, though, we should be well below it, given the strong seasonality — so let’s keep a close on supply.
More graphs below…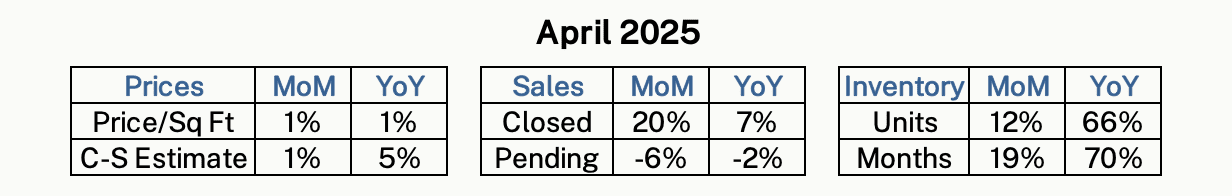


Would love to know what fraction of homes for sale right now last sold pre-pandemic. In my neighborhood it looks the vast majority, which to me suggests most sellers are in no rush or dire need to sell given the massive equity and low payments they secured. Of course buyer demand has been subdued and in a very narrow range since late 2022, basically tracking mortgage rates which have been stuck at 7 percent since then.
Your question made me look at my neighborhood in 92027 (Gated community Rancho San Pasqual in Escondido) nine homes are currently listed which is higher than I recall for the past 10 or so years.
Three of the homes were purchased post pandemic: 2 in 2021 and one in 2022.
Three were purchased between 2015 and 2018.
So the homes purchased post pandemic might be a touch at risk as there have been some price reductions.
The 2022 is 2% above their purchase price so effectively they might break even if they get this but probably a small loss.
The two from 2021 are at 14% and 19% above their purchase price.
Don’t see any potential for short sales or foreclosures.
If I had to guess, the portion on more coastal areas bought post pandemic is lower.
Grok thinks 20-35% were purchased pre-pandemic.
There’s no direct data from the provided sources or general information that specifies what portion of homes on the market in San Diego in May 2025 were purchased prior to the pandemic (pre-2020). However, I can piece together some insights based on available market trends and housing dynamics to give you a reasoned estimate.
San Diego’s housing market in May 2025 is characterized by low inventory, with approximately 2,954 to 4,104 homes for sale in the city and 7,911 in San Diego County, according to various reports. The market remains competitive, with homes selling in about 21–25 days on average, and a seller’s market persists due to high demand and limited supply.
To estimate the portion of homes purchased pre-pandemic, consider the following:
For a precise figure, you’d need to consult local MLS data or a real estate professional with access to transaction histories, as this information isn’t publicly aggregated in the sources. If you’d like, I can guide you on how to access such data or connect with a local expert.
So heres a theoretical… With treasury yields going parabolic, foreign countries abandoning the US dollar, etc… It seems like mortgage rates are gonna spike even higher (possibly 10+ percent)
Will sellers that have wanted to move but have been waiting on the sideline see this and rush to sell before that effects home prices or will the lock in effect just get even stronger.
Going back the the homes I wrote about at a few days, ago of 12 total on the market, 5 are pending now. So sales seem to be going at a good pace and whatever rates they are getting isn’t holding back transactions for now.
Past years, when I’ve spoken to buyers in our area, it seems a large portion came from the greater San Diego area, trading up, getting more size, a more modern home or just want to be in a quieter area.
Often they bring relatively large a downpayment with them as they roll the equity into the new home to ensure they qualify.
So for now, higher rates don’t seem to be having a strong adverse impact on the pockets of the market I look at.
On balance, some of the more extreme economic scenarios seem like low probability events.
As of May 2025, the average mortgage rates being quoted in San Diego, California, based on available data, are as follows:
These rates are based on sources like NerdWallet, Total Mortgage, and Norada Real Estate, reflecting data from May 21 to May 24, 2025. Rates can vary depending on factors like credit score, down payment, and lender-specific offerings. For instance, Total Mortgage noted a 30-year fixed rate as low as 6.375% on May 21, 2025, while NerdWallet reported a 30-year fixed APR of 7.057% on May 22, 2025.
San Diego has not experienced a significant unemployment spike in 2025, with the rate stabilizing around 4.4% as of February 2025. The 5.0% peak in August 2024 was driven by labor force growth rather than job losses. For the remainder of 2025, unemployment is expected to hover between 4.4% and 5.0%, with seasonal fluctuations possible. The region’s strong job market, supported by growth in government, education, and healthcare, suggests stability, though national economic uncertainties could pose risks. For the latest data, check resources like the California Employment Development Department or the U.S. Bureau of Labor Statistics.
This latest data snapshot feels like early evidence of a slow-motion structural shift in San Diego’s housing market. Post-COVID, a delicate equilibrium formed—rate lock-in effects, ADU growth, STR income growth, and stock market gains collectively discouraged sellers, even in the face of normal life events like divorce, death, or job changes.
That balance now appears increasingly fragile. Rising insurance premiums, especially for aging HOA properties, are quietly inflating carrying costs. Add to that higher HOA dues (in no small part due to insurance increases), reserve shortfalls, and tightening STR regulations that are undermining rental income assumptions—and it’s no surprise to see active listings rise. With over 55% of homes in San Diego tied to HOAs, a majority of owners are exposed to these dual financial and regulatory pressures.
Meanwhile, San Diego’s surge in ADU development, once hailed as a housing relief valve, has become a new point of tension. The city’s aggressive bonus ADU program led to a boom in construction, particularly in investor-owned SFRs. But now, public pushback over parking, density, and neighborhood character is driving policy reversals. Proposed rollbacks include parking minimums, caps in certain zones, and added permit scrutiny, signaling that the ADU channel for housing expansion may be narrowing.
If local or state policy tightens further on STRs or ADUs (which seems increasingly likely given current political momentum), we could see a fresh wave of discretionary, investor-driven listings. Layer on even modest macroeconomic volatility, and the market could shift more quickly and more broadly than the consensus currently expects.
Maybe it is reasonable that there finally is so much supply. Housing market can’t just go up forever without a correction.
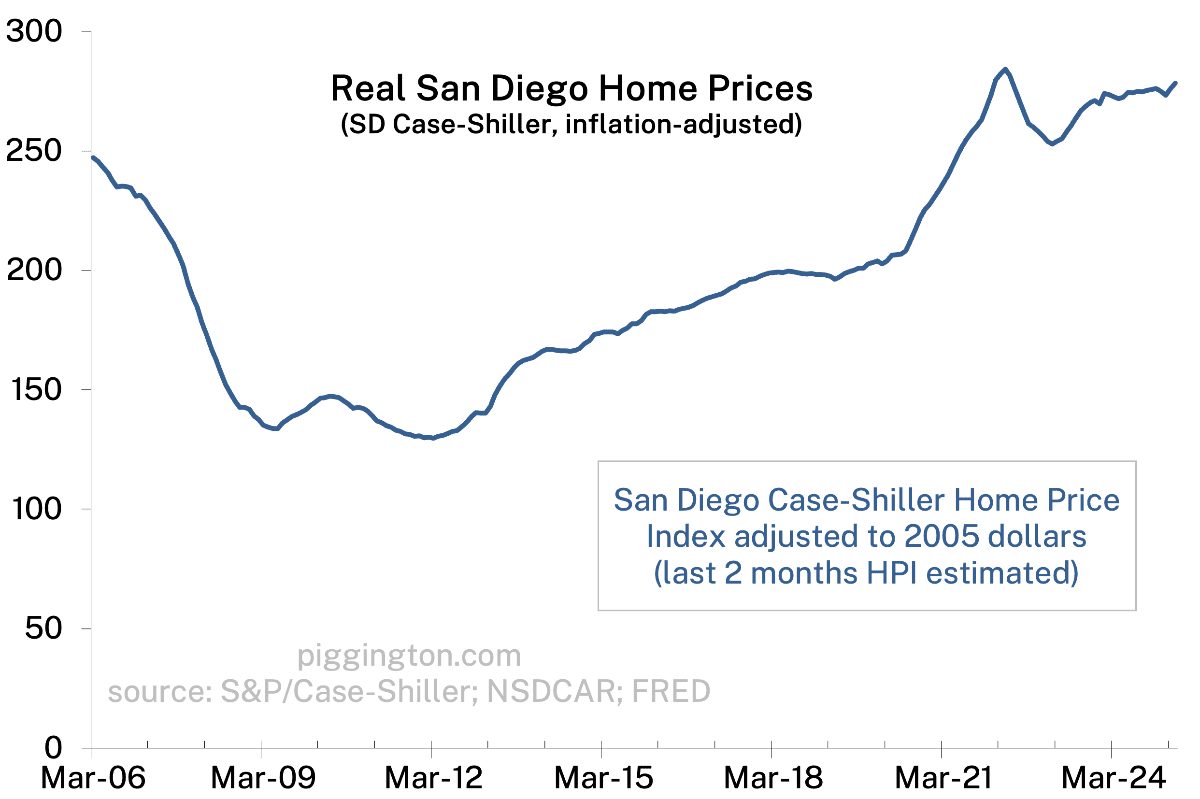
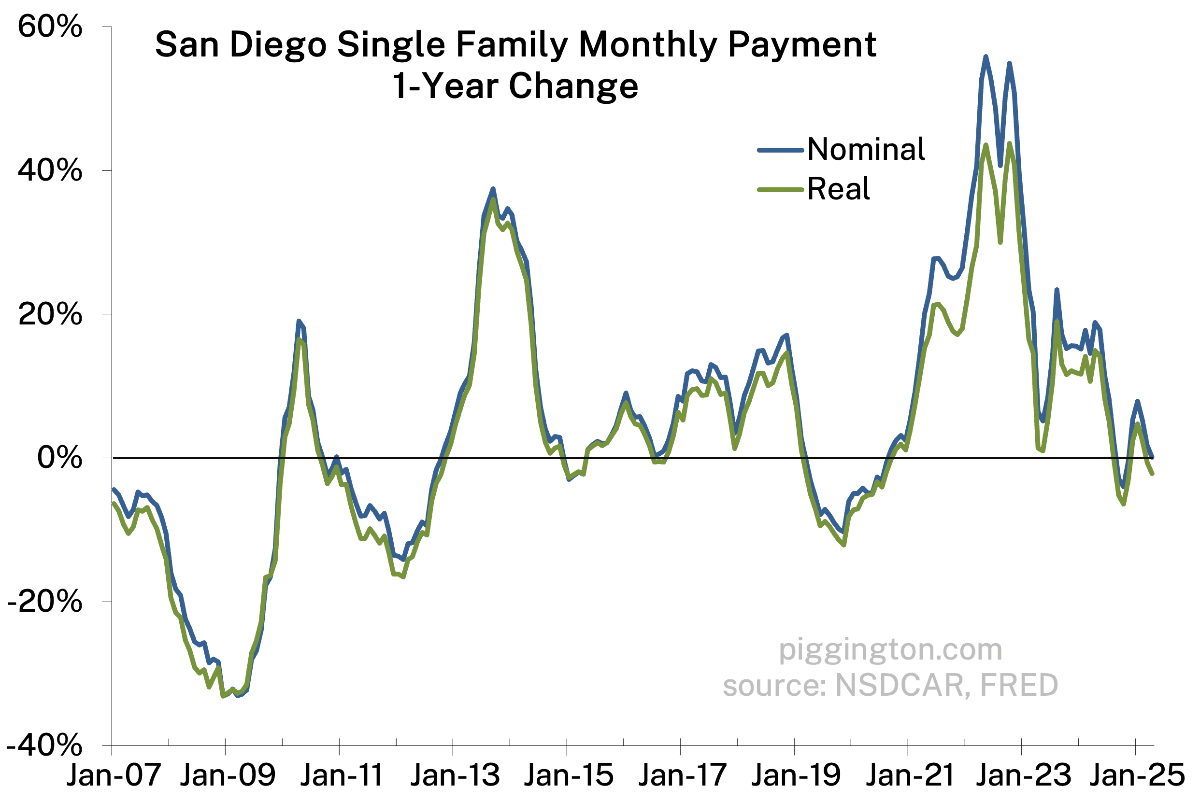
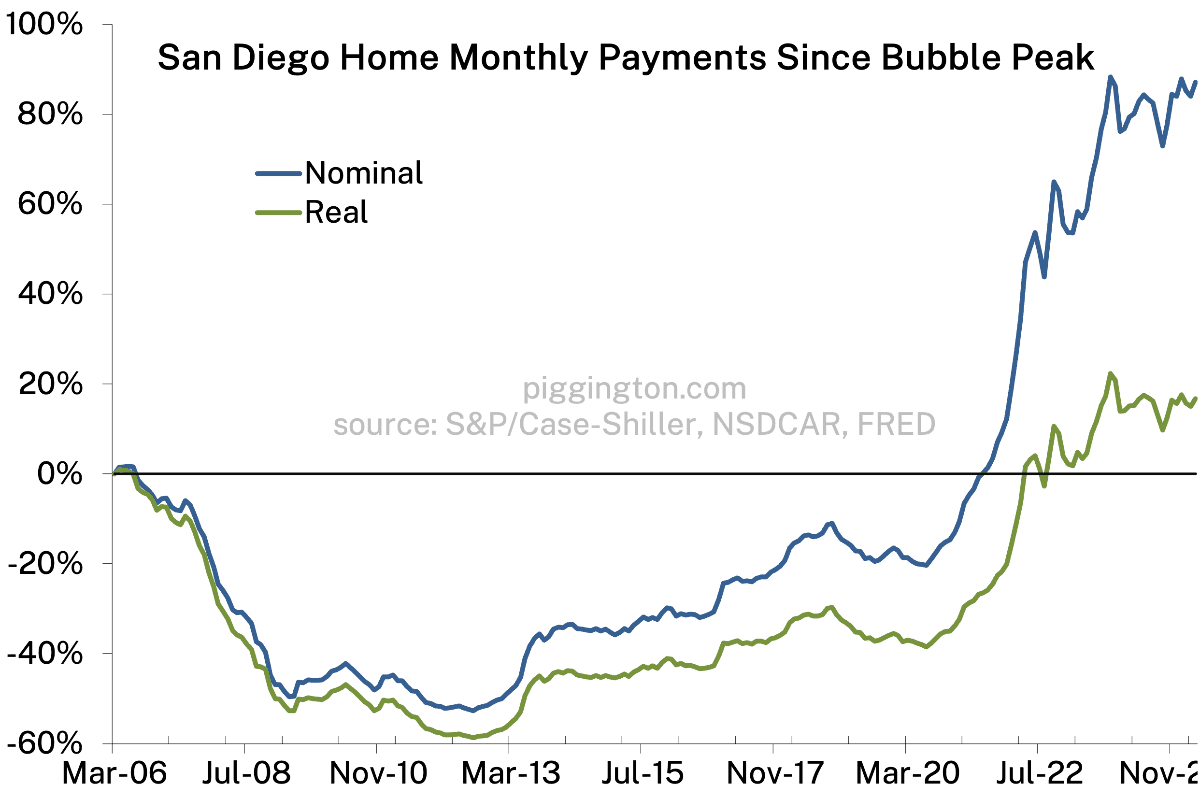
Now would be a good time for a monthly payment graph. My today payment would still be about 30% higher than my September 2022 close during the flash crash and I wouldn’t have NEM 2 solar.
I don’t see detached homes crashing. They can always build more cubes, but they can’t build more detached in San Diego.
I’m not saying this is the same situation or anything, but people were saying the same exact thing as you in 2007
Two entirely different markets. It’s cheaper to stay put for most folks rather than strategic default into a rental. The Fed cutting rates and holding them that low for so long was the greatest F up of all time when combined with 30 year fixed rate mortgages.
Some forced sales and folks willing to take less than they think their home is worth will of course happen, but in an inflationary environment with endless government printing/deficits, owning San Diego real estate with tons of military jobs, a rising China, record heatwaves elsewhere, etc. is high on my list of where I’ll stay parked. M2 just hit a record high.
The 2003-2007 period was straight nuts. I’m a former bank regulator and currently approve/manage billions of mortgages.