Hi all – I’m finally getting around to updating the valuation data;
a full writeup is forthcoming but here in the meantime are some
charts:
Hi all – I’m finally getting around to updating the valuation data;
a full writeup is forthcoming but here in the meantime are some
charts:
Rich, thanks so much for
Rich, thanks so much for doing this. Is it possible to get a chart that shows the change in per-capita income? And maybe a single family home valuation without rent in the denominator? There are a couple things that I’m wondering. How has the relationship between housing (rent & home ownership costs) and per-capita income changed? I suspect, but not really sure, that people are steadily paying more of their income to housing. Does the data confirm that? And if housing as a percent of per-capita income has gone up, is that likely to level off, drop or continue increasing? It seems unlikely with SD’s current housing shortage that this would decrease much any time soon, but can it continue to grow?
Thanks again,
XBoxBoy
Thanks Rich for the updated
Thanks Rich for the updated graph. I personally think the payment index is a lot more important than valuation index. After all, most people don’t buy their house with cash. So, they will always make the decision base on how much their monthly payment would be vs their cost of renting a similar place.
AN wrote:Thanks Rich for the
[quote=AN]Thanks Rich for the updated graph. I personally think the payment index is a lot more important than valuation index. After all, most people don’t buy their house with cash. So, they will always make the decision base on how much their monthly payment would be vs their cost of renting a similar place.[/quote]
Maybe so, but the price valuation index has been the strongly mean-reverting one for oft-discussed reasons. Quoting myself from the last update (http://piggington.com/shambling_towards_affordability_midyear_2015)
[quote=Rich from like a year ago]
Now, there are a couple of issues with the idea that low rates justify sustainably higher valuations:
– They may be lowering monthly payments right now, but that only lasts as long as the low rates themselves. And while everyone seems to have an opinion about the future of interest rates, the fact is that nobody really knows for sure.
– For interest rates to stay low indefinitely would require inflation to remain low indefinitely. And part of the “value” of buying a house is the inflation protection (against rising rents, in specific) afforded by owning your own home. If buyers came to expect permanently low inflation, the inflation protection premium embedded in home prices would be reduced.
I believe that these two factors help to explain why the first chart, which just looks at prices vs. the fundamentals without taking rates into account, has been highly mean-reverting even across a wide variety of interest rate climates.
[/quote]
BTW AN, just to clarify: if
BTW AN, just to clarify: if you are talking about an individual making a purchase decision, seeing if it pencils out, I agree that the monthly payment ratio is super important. That’s what will matter more (as long as they are planning to hold onto the property for a good long while).
But when it comes to the question of how much potential there is for appreciation (or price declines), I think the price one is probably more important.
Rich Toscano wrote:BTW AN,
[quote=Rich Toscano]BTW AN, just to clarify: if you are talking about an individual making a purchase decision, seeing if it pencils out, I agree that the monthly payment ratio is super important. That’s what will matter more (as long as they are planning to hold onto the property for a good long while).
But when it comes to the question of how much potential there is for appreciation (or price declines), I think the price one is probably more important.[/quote]
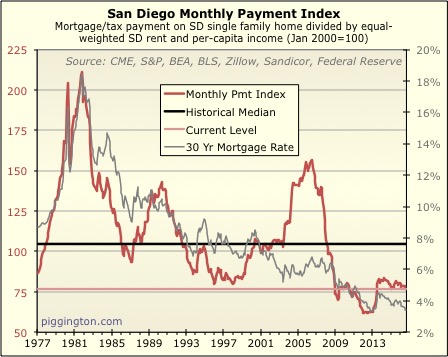
Great charts and info. The monthly payment ratio is shocking. The disconnect between the price index and the monthly payment ratio in recent years is striking. In the three previous run-up in prices the monthly payment ratio correlates well. But what has happened to stop that this time round? I assume the direct reason is rent increases but underlying cause? Ideas:
1. It is harder to get a loan. Forces people to rent. I guess this point has two causes: increased loan standards and/or house prices are exceeding conforming loan limits.
2. Increased population. Competition for rent.
3. Low inventory makes it hard to find a house. Forces people to rent.
But points 2 and 3 should mean massive house price increases. This is not happening so I can only assume that it is point 1. People just cannot get loans to buy in San Diego.
Is there any measure of people qualifying for loans?
bewildering wrote:Great
[quote=bewildering]Great charts and info. The monthly payment ratio is shocking. The disconnect between the price index and the monthly payment ratio in recent years is striking. In the three previous run-up in prices the monthly payment ratio correlates well. But what has happened to stop that this time round? I assume the direct reason is rent increases but underlying cause? Ideas:
1. It is harder to get a loan. Forces people to rent. I guess this point has two causes: increased loan standards and/or house prices are exceeding conforming loan limits.
2. Increased population. Competition for rent.
3. Low inventory makes it hard to find a house. Forces people to rent.
But points 2 and 3 should mean massive house price increases. This is not happening so I can only assume that it is point 1. People just cannot get loans to buy in San Diego.
Is there any measure of people qualifying for loans?[/quote]I think we’re seeing all 3. They’re not building enough new housing to match population growth. We are also seeing increase population, which is why rent is increasing. We are also seeing it is harder to get a loan, which also increases the renter pool, which also causes rent to rise. I think because of all 3, this is what is causing the divergence in the two indexes. Rent is rising faster than the monthly payment (with the help of low rates).
bewildering wrote:The
[quote=bewildering]The disconnect between the price index and the monthly payment ratio in recent years is striking. In the three previous run-up in prices the monthly payment ratio correlates well. But what has happened to stop that this time round? [/quote]
Super low (and declining) rates… unless I am misunderstanding the question.
Rich Toscano
[quote=Rich Toscano][quote=bewildering]The disconnect between the price index and the monthly payment ratio in recent years is striking. In the three previous run-up in prices the monthly payment ratio correlates well. But what has happened to stop that this time round? [/quote]
Super low (and declining) rates… unless I am misunderstanding the question.[/quote]
Yes, I was just wondering about the lack of correlation between the price index and the monthly payment ratio. Can you make a graph of your price index against the monthly payment ratio?
I am not sure that low-interest rates explain the disconnect. My assumption is that low interest rates equal higher prices. But we are not seeing much higher prices.
Oh, I think I get it. Maybe.
Oh, I think I get it. Maybe. My argument for the lack of correlation is that in the long run prices matter a lot more than monthly payments.
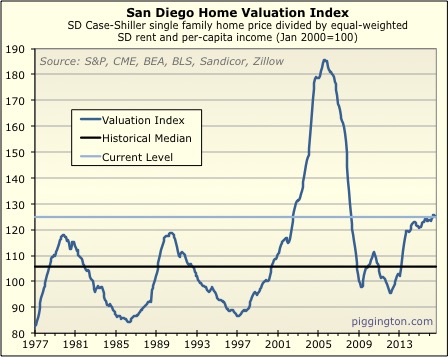
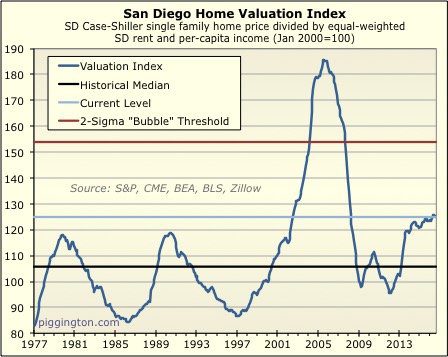
So the valuation chart
So the valuation chart suggests that we’re not in a “bubble”, but the valuation index is at a relative high compared to historical levels and one would expect it’s more likely to go down than up in the short run.
Of course, because it’s multivariable it doesn’t necessarily mean prices will fall.
Rich Toscano wrote:BTW AN,
[quote=Rich Toscano]BTW AN, just to clarify: if you are talking about an individual making a purchase decision, seeing if it pencils out, I agree that the monthly payment ratio is super important. That’s what will matter more (as long as they are planning to hold onto the property for a good long while).
But when it comes to the question of how much potential there is for appreciation (or price declines), I think the price one is probably more important.[/quote]Yes, I’m talking about individual making a purchase decision. I believe they’re the main driver of price (people buying a home and not investors). So, as long as monthly payment is less than rent, even if you don’t plan to stay in there forever, you’re still saving money from day one. Which I think is why people decide to buy.
You’re looking at price in the last 3 cycles and say, look, price start declining when price get above a certain point. But then you can also easily say that look, price decline because monthly payment vs rent is above certain point. You can also say price goes up when monthly payment vs rent is below a certain point. Over the last 50 years, you would be correct because those two indexes track each other. We now have a divergence, so, we get a unique chance to see which one is really the driver of price increase/decrease. I’m betting on monthly payment, because majority of buyers look at monthly payment and not pay cash for their house. I’m assuming w/in 5 years, we get to see how this one play out.
Rich Toscano wrote:
Maybe so,
[quote=Rich Toscano]
Maybe so, but the price valuation index has been the strongly mean-reverting one for oft-discussed reasons. Quoting myself from the last update (http://piggington.com/shambling_towards_affordability_midyear_2015) [/quote]But the last 3 crashes, when valuation was well above the mean, the monthly payment to rent ratio was also well above the mean. Right now, the two indexes diverge. So, we’ll get to see which one is the driver of price decline soon enough.
As for guessing where rate will go, I don’t think it matters. If rate goes up, then the payment to rent ratio will also go up (assuming rent doesn’t go up as well), which would cause both index to be above the mean. Which is be a good indicator of possible down turn. However, until that happen, we can’t really look at the last 3 decline to tell us how this one will play out.
Also, keep in mind that rate has to also go up without inflation. If we experience inflation and income and rent also increases, then the payment to rent ratio might not change, depending on how much inflation vs how much rate rising. I think we’re in uncharted territory.
AN wrote:Rich Toscano
[quote=AN][quote=Rich Toscano]
Maybe so, but the price valuation index has been the strongly mean-reverting one for oft-discussed reasons. Quoting myself from the last update (http://piggington.com/shambling_towards_affordability_midyear_2015) [/quote]But the last 3 crashes, when valuation was well above the mean, the monthly payment to rent ratio was also well above the mean. Right now, the two indexes diverge. So, we’ll get to see which one is the driver of price decline soon enough.
As for guessing where rate will go, I don’t think it matters. If rate goes up, then the payment to rent ratio will also go up (assuming rent doesn’t go up as well), which would cause both index to be above the mean. Which is be a good indicator of possible down turn. However, until that happen, we can’t really look at the last 3 decline to tell us how this one will play out.
Also, keep in mind that rate has to also go up without inflation. If we experience inflation and income and rent also increases, then the payment to rent ratio might not change, depending on how much inflation vs how much rate rising. I think we’re in uncharted territory.[/quote]
It sounds like you are basically saying, if rates stay low, prices can stay elevated. I agree. But I don’t think that’s that useful to know, because you don’t know if rates will stay low. I don’t see why it wouldn’t matter… aren’t you saying that the monthly payment the main thing that matters? If so, that is highly dependent on rate changes, no?
Your second argument, about inflation, is the same as my inflation argument I made. I was saying that if you assume low rates forever, you have to assume lower rent inflation. Your’e saying the same thing but in other direction. The point is that it’s an offsetting force and it’s not as simple as “low rates = high prices” which a lot of people seem to assume… or put another way, it’s a reason that the price ratio is mean reverting across different interest rate regimes.
Definitely a good point about the divergence though. But if you’re going to rest the whole thing on rates staying low forever… that’s a pretty shaky foundation, I think.
One interesting data point:
One interesting data point: if mortgage rates were to go back to the pre-crisis norm (say around 6%), that would bring the monthly payment ratio up to the black “historical median” line. That doesn’t seem like it would be a disaster… still a pretty middle of the road level.
Rich Toscano wrote:One
[quote=Rich Toscano]One interesting data point: if mortgage rates were to go back to the pre-crisis norm (say around 6%), that would bring the monthly payment ratio up to the black “historical median” line. That doesn’t seem like it would be a disaster… still a pretty middle of the road level.[/quote]Good point. However, rate doesn’t move in a vacuum. Do you think rate will go back to 6% while wage and rent stay stagnant? My intuition say no.
AN wrote:Rich Toscano
[quote=AN][quote=Rich Toscano]One interesting data point: if mortgage rates were to go back to the pre-crisis norm (say around 6%), that would bring the monthly payment ratio up to the black “historical median” line. That doesn’t seem like it would be a disaster… still a pretty middle of the road level.[/quote]Good point. However, rate doesn’t move in a vacuum. Do you think rate will go back to 6% while wage and rent stay stagnant? My intuition say no.[/quote]
No, of course not… sorry if I gave that idea. BTW rents and wages are already far from stagnant… they are growing at a healthy clip and have been for quite some time.
Rich Toscano wrote:AN
[quote=Rich Toscano][quote=AN][quote=Rich Toscano]One interesting data point: if mortgage rates were to go back to the pre-crisis norm (say around 6%), that would bring the monthly payment ratio up to the black “historical median” line. That doesn’t seem like it would be a disaster… still a pretty middle of the road level.[/quote]Good point. However, rate doesn’t move in a vacuum. Do you think rate will go back to 6% while wage and rent stay stagnant? My intuition say no.[/quote]
No, of course not… sorry if I gave that idea. BTW rents and wages are already far from stagnant… they are growing at a healthy clip and have been for quite some time.[/quote]
Agree, which would explain why we’re seeing a divergence and why payment vs rent is still at all time low.
Rich Toscano wrote:
It sounds
[quote=Rich Toscano]
It sounds like you are basically saying, if rates stay low, prices can stay elevated. I agree. But I don’t think that’s that useful to know, because you don’t know if rates will stay low. I don’t see why it wouldn’t matter… aren’t you saying that the monthly payment the main thing that matters? If so, that is highly dependent on rate changes, no?[/quote]No, what I’m saying is my crystal ball is broken, so I can’t tell which direction rate will go. When I bought my house at the bottom, I was thinking, there’s no way rate can go any lower, since fed fund rates were already near 0% and we’re in the middle of a Great Recession. So, I bought 2 points to buy down rates (4.5%), 0 point loans were going for ~5%. Oh, how wrong I was. After many no cost refi, I’m now down to 3.375%. I’ve learn my lesson and won’t try to predict rate.
What I’m really trying to say is, since we can’t predict rate, we can’t really how the reverting to the mean will happen. But I agree with you that we will revert back to the mean. What’s unknown is, which index will revert (since we have a divergence).
[quote=Rich Toscano]Your second argument, about inflation, is the same as my inflation argument I made. I was saying that if you assume low rates forever, you have to assume lower rent inflation. Your’e saying the same thing but in other direction. The point is that it’s an offsetting force and it’s not as simple as “low rates = high prices” which a lot of people seem to assume… or put another way, it’s a reason that the price ratio is mean reverting across different interest rate regimes.[/quote]Yes and no. What I was saying is, we don’t know what will cause the increase in rates in the future. Again, since my crystal ball is broken, I can’t tell you what would be the cause. However, just as you said that it’s not as simple as “low rates = high prices”, I can also say, it’s not as simple as “high rates = low prices”. Just look at what happen in the mid 70s to early 80s as a prime example. I think that in order for increase rates to cause a decline in price, we have to have small to no inflation, or at least interest rate would have to increase at a higher rate relative to wage/rent inflation. If we see inflation to match rate increase, then we might still be below the mean in term of monthly payment vs rent. Which, if we see reverting back to the mean, we might still see an increase in price or rate.
[quote=Rich Toscano]Definitely a good point about the divergence though. But if you’re going to rest the whole thing on rates staying low forever… that’s a pretty shaky foundation, I think.[/quote]No, I’m not resting any part of my argument on rates staying low forever. What I’m resting my argument on is, I can’t predict the future of interest rate, so I won’t try. But, I will definitely rest my argument on us reverting back to the mean and I think the reversion of the payment vs rent is much more likely than the reversion of absolute value of the home. So, in order for us to see a reversion back to the mean for payment vs rent, we have to either see mortgage rate increasing at a higher rate than wage/rent inflation, or we have to see higher price. Right now, we’re seeing higher prices. Up until now, value of the home is within rage of of the median, so it wouldn’t cause a reversion. However, right now, we have value being at a point where it should cause price to go down while payment vs rent is at a point now where it should cause price to go up faster (this is leaving out the possibility of rate increasing faster than rent inflation). So, we are in uncharted territory and we will see exactly which index will cause the reversion and how. I can’t tell you the how part, but I’m betting it’s the payment vs rent is will cause the reversion.
XBoxBoy wrote:Rich, thanks so
[quote=XBoxBoy]Rich, thanks so much for doing this. Is it possible to get a chart that shows the change in per-capita income? And maybe a single family home valuation without rent in the denominator? There are a couple things that I’m wondering. How has the relationship between housing (rent & home ownership costs) and per-capita income changed? I suspect, but not really sure, that people are steadily paying more of their income to housing. Does the data confirm that? And if housing as a percent of per-capita income has gone up, is that likely to level off, drop or continue increasing? It seems unlikely with SD’s current housing shortage that this would decrease much any time soon, but can it continue to grow?
Thanks again,
XBoxBoy[/quote]
Working on all that… 😉
Amazing what interest rates
Amazing what interest rates do to charts 1 and 2. I think rents are much more fluid than mortgages. Going forward if/when rates go up (safe assumption I think) then people will stop refi’ing and then sales may slow further. Every car salesman knows it is easy to sale based on monthly payment when rates are low. Did not realize rents were so high. Ultimately it will come to jobs as far as the health of our economy so will be watching the debate tonight.
The interest rate spike in
The interest rate spike in the 80’s was unprecedented as evidenced by this chart https://www.google.com/search?q=chart+of+interest+rates+over+time&tbm=isch&imgil=J9a695bWX6dVUM%253A%253BiN78Lbacuz54UM%253Bhttp%25253A%25252F%25252Fwww.forbes.com%25252Fsites%25252Fphildemuth%25252F2013%25252F07%25252F15%25252Frising-interest-rates-101%25252F&source=iu&pf=m&fir=J9a695bWX6dVUM%253A%252CiN78Lbacuz54UM%252C_&usg=__-JRwCSBOhfnoZhKu9D7L6sfkvKQ%3D&biw=1440&bih=770&ved=0ahUKEwjd4dKJnK3PAhUFJCYKHSJZB_EQyjcIMg&ei=aS3pV52JNYXImAGisp2IDw#imgrc=QsU3m40gX6qm1M%3A however if you interview people on the street my guess is that most would have no idea how unusual it was. It was an interest rate bubble possibly caused by oil prices.
Is there any place in this
Is there any place in this site explain why home valuation index and monthly payment index is defined the way it is? Why are we using equal-weighted SD rent and per capital income in the denominator for both index?
Those are the things that
Those are the things that drive home prices long term (as seen in the mean reverting nature of the first graph). I used to track them separately but I prefer combining them for a single big-picture view.
A few people have requests that rents and incomes be broken out, so I’ll be posting that here sometime soon.
Rich Toscano wrote:Those are
[quote=Rich Toscano]Those are the things that drive home prices long term (as seen in the mean reverting nature of the first graph). I used to track them separately but I prefer combining them for a single big-picture view.
A few people have requests that rents and incomes be broken out, so I’ll be posting that here sometime soon.[/quote]
Thanks, Rich. Are all of data that you used to produce these charts freely available on the web? Are there some proprietary data that you will need to pay to have access to?
It’s all freely available,
It’s all freely available, the sources are listed on the charts. (The one exception is the price/sqft data to do the latest-2-months CS estimate, but other than that).
I think the mortgage cost
I think the mortgage cost graph is the best one and prices will keep rising on low rates. Rent and income growth have been pretty close to each other so seperate graphs will not show much different.
It just dawn on me today that
It just dawn on me today that another example of why monthly payment is much more important than the absolute value is what we’re seeing over the last decade in the smart phone industry. People are much more open to pay for a new $650-850 smart phone every other year (some even do it every year) than buying a $1000 computer. I think that is because a smart phone is being paid over 24 months, so, it’s only $2x-$3x/month.
When people have to pay $650-850 up front, they’re more likely to ask themselves, do I really need this. Can I get by with a $300 phone instead. That’s exactly what they did with computers. However, when given an option to pay the monthly payment, most chose the monthly payment and they justify for the constant update and choosing the more expensive model because it’s only a few $ more a month.
Is it possible to break out
Is it possible to break out the data by school district, I never understood why the housing affordability charts don’t reflect the reality of why most people buy a house, which is to have a family and send their kids to a good school.