When home prices rise, homeowners tend to spend more money. In some cases their newfound real estate wealth emboldens them to save less and spend more, while in other cases they actually borrow against increased home values to increase their spending money. In either scenario, the net effect is that people buy more stuff.
This so-called “wealth effect” is a widely acknowledged side effect of asset market booms.
Cool data correlation! In
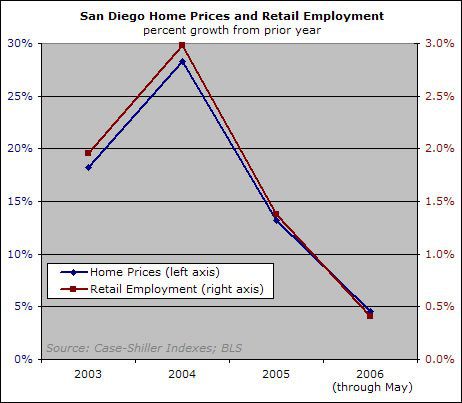
Cool data correlation! In May 2006, wholesale and retail trade was 219,000 jobs in San Diego County. It is the largest employment category, besides government (also 219,000). Thus, every percentage change is a big deal.
The correlation is actually
The correlation is actually somewhat surprising. Do you think retail employment is boosted by the increased consumer spending due to the wealth effect? That part wouldn’t surprise me. However, shouldn’t there be a lag?
~lamoneyguy
In Ahead of the Curve,
In Ahead of the Curve, Joseph Elliott charts economic activity. He found that interest rates and wages are coincident with consumer spending, so they are not leading indicators. I guess as soon as home prices increase, people feel wealthier and spend right away. I would expect a lag in retail hiring by a 6 – 12 months, based on Elliott’s data (employment lags spending by one year).
My only explanation is that the median is a lagging indicator as we discussed before. So the lag is really 1 year.
The median rose 30% in 2004, but home prices were really rising before that, and hiring was just ramping up. Prices softened and started dropping in late 2004; thus the lower employment hiring in 2005.
This is an amazing graph.
This is an amazing graph. One of those I’d like to see trended out over decades to see how it holds true in general. For me, 4 data points do not a complete analysis make.
Also, I think we have to be very careful of making an assumption, then using this information to show our assumption is correct.
Remember – the number 1 rule of statistics is – statistics do not prove causality. Just because we see umbrellas and rain at the same time does not mean umbrellas cause rain.
Without any prior assumptions, one could conclude one of the following from this graph:
1) Home prices affect retail employment.
2) Retail employment levels affect home prices.
3) A third element is in effect which has the same effect on both.
I vote for #3. From this graph, I learn that at the most basic level, the wealth effect is not really about home prices, but about EZ credit.
In other words, even if people’s house values went down, and they were stil able to borrow money to buy retail goods, they would.
Another bit of evidence that this is a credit bubble first and a housing bubble second.
sduuude, that makes sense.
sduuude, that makes sense. Although we know that MEW fueled spending, credit cards have certainly helped. Item #3 could be low interest rates on debt.
However, the wealth effect is a studied and accepted phenomenon. People spend more money when their stocks and home prices rise, even with stagnant incomes.
Joseph Elliott’s charts, spanning 5 decades, show that “real earnings and interest rates, with their common dependence on rising or falling inflation, ar key drivers to be monitered in predicting consumer demand.”
He has this to say about the wealth effect:
“Extraordinary stock market profits for a large proportion of Americans – the much heralded “wealth effect” resulting from the technology, general economic, and stock market boom of the late 1990s – POSTPONED, but did not prevent, the inevitable effects of slowing real hourly earnings, which drove the sharp slowdown in consumer spending growth that begain in mid-2000 and continued throughout 2001.”
Thus, interest rates and real hourly earnings determine changes in consumer spending. The wealth effect can postpone the slowdown in consumer spending caused by flat wages. It has a strong impact. In the end, what drives spending: real hourly wages.
We have to keep this in mind. It is not MEW that fuels the economy, it is real hourly wages. Although the MEW prop gave a temporary injection to consumer spending, it will eventually be removed. Then we can predict consumer spending by looking at real hourly wages. If wages started rising, it could make up for the loss of MEW.
I think retail employment
I think retail employment may be one of the first things to pick up during periods of increasing spending (and the first to fall during decreasing spending). The retailers feel the need for new employees right away. I doubt there is much of a lag – maybe a month or two. When you don’t have enough people to help all the customers, you hire more as soon as possible. It takes longer for manufacturing to get the news as they are at the end of the line.
I think you’re right, PD.
I think you’re right, PD. So it looks on the graphs like they are moving concurrently, but there is probably a short lag.
PD –
Perhaps retail
PD –
Perhaps retail establishments realize they can take on more debt to finance growth – as a result of lower interest rates – while the housing market starts to grow.
P.S.
I think spending is
P.S.
I think spending is really the sum of new debt (be it MEW, or credit card or borrowing) plus income. We know that new debt must start to go negative as as people buy down the loans they have taken. This means, not only is there less MEW, but negative MEW.
So, even if income does rises, spending must come down.
I’m just saying that of house prices, EZ credit, and retail employment, the root is EZ credit, not house prices. And, yes, low interest rates on debt is a big part of EZ credit.
I agree. I’m like a
I agree. I’m like a teeter-totter today. Agree here, agree there 🙂
Elliott’s models spanning back to the 1960s were created before we replaced the business cycle with the debt cycle. Historically, real hourly wages led spending; now it is availability of credit. We are a debt based society now.
So Powayseller,
Are you
So Powayseller,
Are you telling us that you think there has been a paradigm shift? Is this a new era? 🙂
It is the end of a new era,
It is the end of a new era, where people could borrow more than they should with nothing more than a signature.
The paradigm has shifted, and is now shifting back to a place where spending must obey income, because you can’t borrow like that anymore.
Our society shifted from
Our society shifted from manufacturing to services to debt creation. Now back to savings and production? That is my dream. That’s not a paradigm shift at all, just evolution of a society. Reversion to the mean and other fundamental rules apply, regardless where you are in the cycle.
Interesting.
Got a
Interesting.
Got a suggestion. I’ve seen graphs of home prices (normalized or other) and graphs of home sales. (same type of scales)
If this hasn’t already been posted elsewhere, how about a graph of actual sales divided by available inventory?
During the hot days of the SD real estate market, I suspect this ratio was close to or even greater than 1.0. Today, the ratio is somewhere around 0.15 This would be an interesting indicator to compare to home prices.
Asterix
This is months inventory.
This is months inventory. Inventory divided by the previous months closings.