It’s time for some valutions. The charts below show San Diego
housing valuation ratios updated through
year-end 2010.
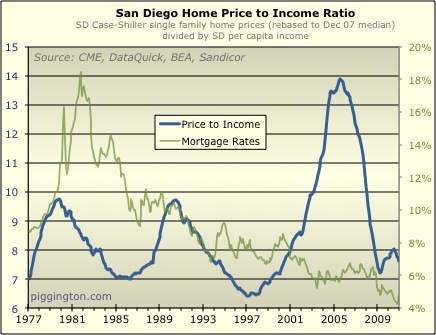
Let’s start with the price-to-income ratio. The decline in home
prices since the summer brought this ratio back down to 7.6 — right in
the middle of fair value territory per these
ratios. In fact, it’s 5% below the median price-to-income ratio
over this entire period (which incidentally is 8 on the nose).
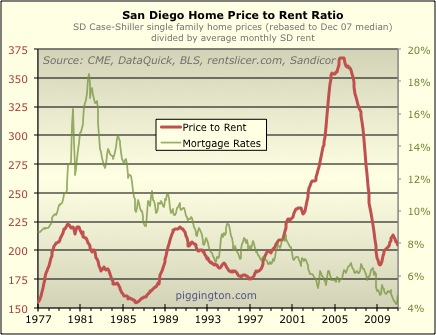
The price-to-rent ratio came even closer to hitting its “fair value” at
just 1% above its historical median. (I have theorized
that the higher price-to-rent ratio reflects slightly depressed rents
as a result of the bubble-era building frenzy).
So compared with incomes and rents, San Diego home prices
in aggregate were more or less at fair value as of the end of 2010.
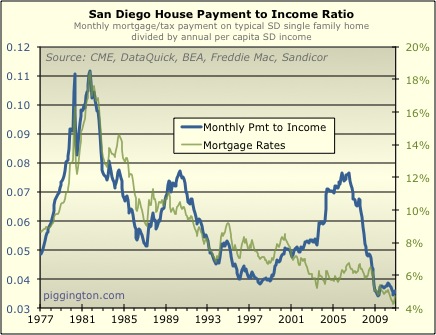
Middle of the road purchase prices combined with ultra-low mortgage
rates to
get us back near historical lows in the payment-based valuation
ratios. The monthly-payment-to-income ratio was 39% below its
historical median!
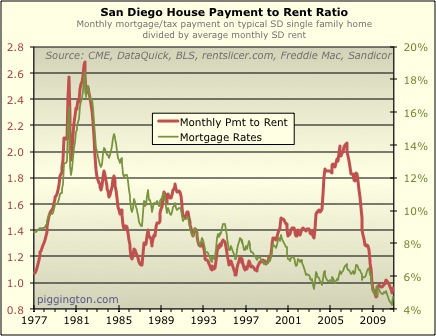
And the payment-to-rent ratio was 32% lower than its median value:
So what does this all mean? There are really two separate
questions to grapple with:
- What will happen to home prices?
- When, and under what conditions, does it makes sense for an
individual to buy?
The second set of graphs, the payment-based ratios, are much more
relevant to the second question. I’ve argued a million times
(latest iteration here,
I
won’t drag everyone through it again) that price-based ratios are
much more important than payment-based ratios in determining whether
housing is fairly valued on a sustainable basis. Payment based
ratios are a relatively minor factor as far as question #1 is concerned
— but they are hugely important for question #2.
If you buy now, and you get a big mortgage (high loan-to-value ratio),
you are locking in a monthly payment that has effectively never been
lower in comparison to regional incomes and rents. (I am of
course referring to the county in aggregate, as some areas remain more
expensive… so assume for this article that we are talking about the
“typical” home as measured by the aggregate number charted
above). To the heavily mortgaged buyer, San Diego housing has
never been cheaper.
But that’s not necessarily a reason to run out and buy, because to the
extent you intend to sell the home in the future, you have to consider
question #1. Low mortgage payments are of little consequence if
you are just going to sell the house 5 years down the road. In
that case, the primary driver of how well you do in the transaction
will be what’s happened with home prices when you sell.
But if you are hanging onto the home indefinitely, that’s something
different. In that case — assuming that you intend to buy a
house with money that is mostly borrowed — the future path of prices
is less important than the future path of payments. Put another
way, who cares what happens to the home’s market price if you are
sitting tight and making generationally low monthly payments the entire
time?
Of course it’s possible that payment ratios could go even lower.
But catching the exact bottom is a speculator’s game. One could
argue that monthly payment ratios 30-40% below the three-decade median
should be “close enough.”
This is why I believe it can be a very good deal to buy in some
cases. But there are conditions:
- You have to be willing and able to stay in the house for a very
long time (long enough that the lower mortgage payments outstrip the
effects of potential negative price changes… I’m too lazy to
calculate this but it’s probably in excess of a decade) - You have to buy a home that is reasonably priced (while San Diego
in aggregate is reasonably priced, there are still pockets of
overvaluation) - You have to get a big mortgage (or put another way, you should
put as little down as possible)
To the extent that these conditions are not in place, one has to shift
focus on to question #1: what will happen with home prices?
Well, we are out of the danger zone of high aggregate valuations as far
as the price-based ratios are concerned. But unlike with
payments, home prices are not actually cheap. They are right
square in the middle of their historical range. While this
removes the dangers posed by overvaluation, it certainly doesn’t rule
out a move into undervaluation. It has happened in the past, and
that was after housing booms that paled in comparison to the latest
one, and at times that the economy didn’t face the structural problems
it is facing now.
My own suspicion, and this is purely a guess, is that valuation ratios
will drift downward in the years ahead. Not plunge, but drift
downward. This is based on headwinds to housing price growth I
anticipate: a big foreclosure backlog, structurally high unemployment,
higher rates, and the potential for a serious economic downturn (plus much higher rates) as a result of a
US sovereign debt crisis. (I know I have said that rates don’t
impact valuations as much as many people think, but nothing happens in
a vacuum — a sufficiently large and sustained rise in rates could
certainly exert some downward pressure on valuation ratios, at least
for a time).
That said, unless (until?) rates really get out of control, I don’t
imagine that there will be big moves down in pricing. The
scenario I envision is valuations grinding downward over a course of
years, but doing so against an ongoing rise in wages and rents.
As long as the process is slow enough, valuations could drop quite a
lot without having too much of an impact on nominal home prices.
(This is usually when people start arguing that nominal wages and rents
will flatten or decline over the coming years… I hope that by now
everyone has come to understand that the Fed isn’t going to let this
happen).
So, let’s sum it up…
- In aggregate, San Diego home prices are right in the middle of
the road — they are neither cheap nor expensive based on their
historical relationship with rents and incomes. - My speculation/guess about the future is that that negative
structural factors in the years ahead will lead to housing lower
valuations, but not necessarily to significantly lower nominal prices
(with the potential for substantially higher interest rates being the
wildcard in this forecast). - Irrespective of price forecasts, mortgage payments are so
historically low in comparison with rents and incomes that it makes
sense to buy a reasonably priced home with a high loan-to-value ratio
so long as the buyer intends to keep the home for a long time to come.
Nicely put Rich. Thanks for
Nicely put Rich. Thanks for updating those graphs. I share you sentiment exactly.
Looks like you may need to
Looks like you may need to start a new site. Housing is getty kind of boring. Or just convert this one to a full blown site for political rants.
Great post Rich,
I am about
Great post Rich,
I am about to close on a house and thanks for confirming that the mortgage payment I will be making is historically low when compared to income. Yes, I plan to be in the house for a long time b/c I hate moving so if prices go down and interest rate goes up it won’t affect me that much.
Jimmy
SD Realtor wrote:Looks like
[quote=SD Realtor]Looks like you may need to start a new site. Housing is getty kind of boring. Or just convert this one to a full blown site for political rants.[/quote]
There is very little fun and no money in political rant sites. If were voting or making suggestions, I say sports, porn, car reviews, penny pinching or relationships. Those OT’s always get the most play. Let’s face it, we saw this coming, the long flat part. Flat charts, flat markets, flat tires, flat chests, nobody turns their head for any of them. But theres still a lot to learn and do until volatility returns to this asset class. From just an educational standpoint, if it weren’t for FLU and his car threadjacks, I’d be rolling in a BMW right now, hell I didn’t even know they had model numbers for engines that were different from the actual model number of the car. But thanks to the OT’s, not only do I know the various technical issues and recalls, I’m scared of them. Now I’m looking at Expeditions and Tahoes again, and I dont’s even haul kids around anymore since they drive themselves. Let me add two more suggestions, environmental issues and potential personalized license plates. I’m going to combine the two, so when I’m cruizing in my 4×4 american consumer beast, feeling mildly guilty, I’ll blame FLU and piggington. Im even working on a license plate for my ameribeast. Perhaps PIGNTON, PROFPIG, FLUSAID, TG 9MPG, FLTPART, RPORYDER, BMWFEAR, REOSLUT, SFR 4ME, BAILOUT, NOINTRST, NEG AM, 3CARGAR, FYRNORV, or my all time fave, TKSRICH.
Didn’t Eliott Wave guy Robert
Didn’t Eliott Wave guy Robert Prechter famously predict a big market crash and depression coming in 1995 right on the eve of one of the biggest 6 year bull markets in U.S. history? Talk about getting that one wrong. He seems like more of a “permabear” type. A broken clock is always right once a day.
TG, somehow I missed your
TG, somehow I missed your comment above and just saw it now. Awesome.
You are right, as far as alternate site topics go, politics would be last on my list. To your list of favored topics I’d add: wine, sharks.
As far as your beast is concerned, note that the official stance of the Piggington editorial board is that gas prices are going substantially higher (though not in a straight line, of course) over the decade ahead. I recall you mentioned once that your employer reimburses you for gas, so perhaps that’s not a consideration… otherwise, BLMEFLU.
This is usually when people
I think your prediction is the most likely outcome assuming the fed can really control markets as well as we all think right now. I personally don’t put nearly as much faith in the assumption that the fed can control thinks to the level that everybody thinks they can. I think “Don’t fight the fed” is going to go down in history as one of those catch phases that attempts to explain why it’s different this time, but in the end it will fail. I certainly could be wrong, but there’s usually something that everybody gets wrong and don’t fight the fed seems to the one area that nobody questions anymore.
livinincali wrote:
I think
[quote=livinincali]
I think your prediction is the most likely outcome assuming the fed can really control markets as well as we all think right now. I personally don’t put nearly as much faith in the assumption that the fed can control thinks to the level that everybody thinks they can. I think “Don’t fight the fed” is going to go down in history as one of those catch phases that attempts to explain why it’s different this time, but in the end it will fail. I certainly could be wrong, but there’s usually something that everybody gets wrong and don’t fight the fed seems to the one area that nobody questions anymore.[/quote]
My prediction is not based on the Fed’s ability to control markets, it’s based on their ability to reduce the nominal purchasing power of the US dollar. That’s not “controlling the market,” because all it requires is sufficiently increasing the supply of dollars in circulation, which is a factor they can control.
FWIW I don’t believe they can control markets (obviously they can in the short term, as QE has shown, but in the long term their efforts will fail).
My prediction is not based on
Ok, that’s fair enough, but I think the inflation process needs to include credit emission and I’m not sure if they control that. The idea for the fed has always been if we create more base money supply the credit and inflation will follow. One could imagine the scenario where base money supply increases but credit does not and that would likely limit inflationary forces. Basically what we are seeing now with the federal government being the only reason credit is expanding.
It ultimately comes down to whether or not the fed can prevent deflation and force inflation via QE and debasing the dollar. My belief is the fed can’t even force/control that over the long term, but maybe they can. I would argue that if not for the federal government borrowing we’d already be seeing deflation regardless of the fed’s actions. Of course as long as the federal government obliges with record deficits I can’t prove that.
If the federal govt were to
If the federal govt were to stop borrowing, the Fed would find another way to get money/credit into the economy. They change the rules when it suits them. But it doesn’t matter, because the federal govt isn’t going to stop borrowing until the foreigners take away our credit card — and that won’t be deflationary.
This topic was addressed in great detail here: http://piggington.com/no_deflationary_spiral_forthcoming
How has QE kept down the
How has QE kept down the interest rates? Rising rates could be a game changer in the next couple of years. Otherwise, it looks like a slow grind downward. Hard to find any evidence of a scenario where RE prices rise in the next few years.
I wasn’t talking about
I wasn’t talking about interest rates…
Thanks for the great analysis
Thanks for the great analysis Rich. For the last year I have really been struggling with where we are in the market cycle. Everything I saw said it was relatively safe to go out and buy again. But I always have had a hard time telling people “its a good time to buy”. I’m just too conservative a thinker to get past that easily.
Several months ago, I got there and for the first time in a long while can say confidentally that for most people it is a good time (assuming they are well informed and buy well). Seeing these graphs just gives me even more confidence. While housing still feels very expensive here, it always has been expensive here relative to most places. I beleive folks expecting dramatically lower prices from here are fooling themselves. The window of opportunity is open and how long it remains thus at these interest rates is anyone’s guess.
Congrats to all the Piggs who have gotten themselves great homes the last couple years avoiding the worst declines and good luck to the rest who have the opportunity to do the same.
QE has not kept rates down
QE has not kept rates down and CA unemployment is persistently at 12%, without relief anywhere in sight. The grind down may be slow or there could be events that cause real trouble. The only saving grace is that ratios, as Rich’s data points out, are now at about historic medians.
3.5M people will be shoved off unemployment checks this year as they hit their 99th week. The state and local govts within CA are at all time budget gaps. They may have to cut jobs.
These are just two things that come to mind.
A new lower low is coming
A new lower low is coming within the next 2 years. The low in the spring of 2009 will be taken out. According to Elliott Wave Theory, the rebound of last year is the wave 4, and the wave 5 has started since last autumn.
I have predicted the price evolution of the last 2 years on this board (in a comment to one post by Rich about 2 years ago), but most people laughed at that time. Temeculaguy even said he would do something if my prediction turns out to be true. Now the rebound has passed, and a new lower low is coming. We will see what happens by the summer/winter of 2012.
You statement is far too
You statement is far too braod to have much meaning. The low of 2009 isnt much below where we are now in many places, so taking that out would not be such a big deal. In other places we are lower than where we were in 2009. Other places where 2009 prices were much below today (i.e. $150K SFR homes in Oceanside) wont get back below that.
I dont know that anyone laughed at your post as what has happened the last 2 years is much in line with what most of us expected also. Is this the one you were referencing?
http://piggington.com/the_next_big_step_down_is_coming_to_midhighend_areas_new_you
paranoid wrote: According to
[quote=paranoid] According to Elliott Wave Theory… [/quote]
We may indeed see lower lows (although I doubt it – I think we’ll drift down a bit more from here without piercing the previous lows), but it will have nothing to do with Elliott Wave Theory, on which I defer to analyst David Aronson:
“The Elliott Wave Principle, as popularly practiced, is not a legitimate theory, but a story, and a compelling one that is eloquently told by Robert Prechter. The account is especially persuasive because EWP has the seemingly remarkable ability to fit any segment of market history down to its most minute fluctuations. This is made possible by the method’s loosely defined rules and the ability to postulate a large number of nested waves of varying magnitude. This gives the Elliott analyst the same freedom and flexibility that allowed pre-Copernican astronomers to explain all observed planet movements even though their underlying theory of an Earth-centered universe was wrong.”
To paraphrase the title of an old book on the stock market: “Where are Robert Prechter’s clients’ yachts?”
Davejlj, two years ago, I
Davejlj, two years ago, I didn’t bother to argue with many who laughed at my prediction. Today I just say again, we will see.
Btw who is David aronson?
paranoid wrote:Davejlj, two
[quote=paranoid]Davejlj, two years ago, I didn’t bother to argue with many who laughed at my prediction. Today I just say again, we will see.
Btw who is David aronson?[/quote]
I’m not laughing at your prediction. I’m merely questioning the basis for your prediction. If I tell you it’s going to rain tomorrow because “I can feel it in my bones” I hope you won’t think I’m some kind of weather predicting genius if, in fact, it does rain tomorrow.
David Aronson (with whom I neither agree nor disagree in any general sense, just to be clear):
http://evidencebasedta.com/
I keep an eye on the
I keep an eye on the apartment buildings in the area and for a cash buyer, there arent many deals out there.
Cap rates are 6% and lower, not very appealing. Actually once you start looking at the operating statments of apartment buildings for sale, cap rates are more sub 5% as they sugar coat the marketing package for the unsuspecting buyer.
I am waiting for the cap rates to come into the 8% range before jumping into this market. Maybe next two years.
Rich,
I read your blog
Rich,
I read your blog frequently and think it’s great. I’m not trained in the economics lingo, though. Can you clarify this from your summary: “…lower valuations, but not necessarily to significantly lower nominal prices.”
Also, I know the focus of your analysis is San Diego County, but do you know if there is a pretty strong correlation between the San Diego market and one county north where I live in Orange County?
Thanks,
Bob
Valuations = price/income
Valuations = price/income ratio and price/rent ratio.
Yes, I think there is likely a strong correlation with OC…
Bob
I do a fair amount of
Bob
I do a fair amount of business up in OC as well as in SD. From what I have seen over the years, OC tends to lag what is happening in SD by 6 to 12 months.
Right now things seem rather slow up there to me while things are moving well again in SD. It seems like OC is in a bit of a depreciation cycle right now but that is just what I’m seeing. Could be different things going on that i am not seeing.
sdr
We may not see prices rally
We may not see prices rally significantly. But what we are seeing is homes built when materials were much cheaper selling for fabulous value. You can purchase some superior built homes, in the higher end, that you could not rebuild for the same price plus some, today. The land is thrown in for free. So any new builds need to be of a lower standard of quality, as costs have risen dramatically – take a look at copper, steel, energy etc. The market will recognize this when the distressed sellers are finally and eventually cleared out. So opportunity still exists now. It is not only the statistical prices, but what home you are getting for the price. Interest rates will rise significantly. It may take another year. The market will do it well ahead of any fed action. We have already seen the first signs of that over the past month. So Rich is correct, if you are able to leverage with a great fixed rate mortgage. Getting one is a whole new endeavor than it was only a short time ago though.
Do you have a chart which
Do you have a chart which shows interest rate at the time? Anything interesting there, I’m interested in seeing the relationship – maybe it’s so obvious to others that it doesn’t need a chart.
Mortgage rates are the green
Mortgage rates are the green lines on the charts.
In case anyone is interested,
In case anyone is interested, here are some further thoughts on the
distinction between the price-based and payment-based indicators, taken
from my voiceofsandiego.org
article on this same topic:
Rich – what are the
Rich – what are the assumptions about down payment for the monthly payment to rent graph?
The last graph seems to say that, today, monthly mortgage payments are about equal to rent payments, even a little less as it’s currently under the 1.0 mark.
I know you’re dealing with medians, and maybe that explains it, but this doesn’t make sense from my personal experience looking at rentals vs. sale listings in most areas of SD. Currently, we rent a house for $2,550 that would sell for around $600k. I would have to put 36% down to force a mortgage payment of that amount (assuming 1.2% prop tax rate and 4.5% mortgage rate).
Am I just getting a super deal on my rental?
The absolute values of these
The absolute values of these ratios aren’t really meaningful, due not only to medians but to having to to use different property types to get those medians.
In any case, you live in an above-median area, which means a couple things. First, price-to-rent ratio is always higher in higher priced areas… that’s just the way of things. Second, a lot of those areas are still somewhat overpriced in comparison to the fundamentals.
excellent series of graphs
excellent series of graphs and write up. right on target as always.
agree with sdr, has been hard to give an unequivocal “get out and buy” due to so many variables. Afterall, still with many sub-segments with higher than realistic prices and still with many sellers with unrealistic asking prices. the issue of purchasing with high LTV is a concern too, as Rich is right, we are looking at a flat if not somewhat downward slope when it comes to prices. hard to give a thumbs up to run out and buy if someone ends up having to sell in near-term and will need to cough up the 6% commission.
but otherwise, if you are in for the long haul, if you got plenty of cash on the sideline, and you know to avoid the high priced bombs, this is and has been a fantastic time to get in and lock in historic low interest as the icing on the cake.
Do you think that the prices
Do you think that the prices will only decline slightly with the major mortgage changes planned (higher rates, higher downpayments,less FHA, less Fannie, etc)?
Or are you saying this assuming the current mortgage landscape won’t vary much?
I think this is great data
I think this is great data but I question it’s accuracy. Specifically, on the first graph for Price-vs-Income the ratio has dropped from 14x to 7x yet I don’t think home prices have dropped by 50%, have they? Some areas have but I thought the citywide average was 30%. Did incomes rise? Not that I remember reading.
Also, are these high long-term averages (6x-7x) a good example of the ‘sunshine tax’ for living here? Everything I’ve read has said that long-term averages for price-to-income have been 3x — and 4x for more desirable areas. So is San Diego really so desirable that it averages 6x or 7x?
Yes, incomes have risen since
Yes, incomes have risen since 2006 (which is when the 14x ratio have happened). The Case Shiller index for San Diego was down about 42% at its lowest (when the ratio got to 7x). It’s very easy to go verify this data on your own if you doubt its accuracy — all sources have been noted in the charts.
The absolute levels of the ratio don’t bear comparing to generalities such as 3x income. There may be all kind of differences, notably whether you use household income or per capita income (as in these charts). So it’s just comparing apples to oranges.
In any case, the answer to the implied question is yes, as the chart shows that for over three decades San Diegans have been willing to pay an average of 8x per capita income for a typical house.
Do I have access to those
Do I have access to those data sources, though? I thought most of that was paid-access only.
_______
In general I’m just commenting because the numbers don’t seem to pass several ‘sanity’ tests. The first was the observation that prices didn’t drop 50%. If the data shows that they dropped 42% then incomes would have had to rise 16%, and I don’t remember hearing anything like that. Even spread across 4 years that would mean incomes had risen an average 3% (?) per-year. And this is during the biggest recession of our lifetimes?
This UT story from last Aug 2010 says the opposite, that incomes dropped 2%,
http://www.signonsandiego.com/news/2010/aug/13/prices-rise-san-diego-county-income-falls/
The second sanity test is the idea that people can afford an 8x ratio. Without bring a lot of additional cash (down payment) I don’t see how anyone could afford such expensive housing. For instance, if the median home price is $372k and median income is $36,802 (both numbers were from Aug 2010, I believe) then that makes the ratio 10x. With a 30-year mortgage at 4% (which would be the theoretical ideal here?) and no other expense, this ‘median’ family could borrow $217k. The remaining $155k would be a 42% down-payment! And that’s with unrealistically low rates and personal expenses.
I find it hard to believe the ‘average’ home-buyer in San Diego puts down more than 40%. I don’t know where the disconnect happens but I still question these numbers. Maybe it’s wrong to use the income for the general population since only 67% buy houses? Is there data about the median income of San Diego HOME BUYERS specifically? If we exclude the data for the 23% lowest-income group what does that make the median income for the remainder? I still have a hard time believing it’s sufficient to pass my second sanity test.
Yes, all the data is freely
Yes, all the data is freely available (if it weren’t, I wouldn’t have said that it’s easy for you to go look up). What else can I tell you? If you don’t believe it, go look it up…
OK I can’t really believe I’m
OK I can’t really believe I’m doing this (ie engaging in a conversation about whether the data is right when it can just be looked up very easily from the sources). But in the interest of helping you out here are some of the mistakes you are making in your analysis:
1. The market peaked in 2005. That means there have been 5 full years (plus a few months) of income growth since the peak. 2 of those years were before the recession began, and 3 of those years were before the recession got really nasty. You cherry picked the one shorter time period in which incomes actually declined, while ignoring the rest of the 5 years.
2. In your analysis of affordability you have completely ignored the distinction I made between per capita income (which I use in these charts) and household income (which you area clearly using from the fact that you discuss the “median family.”)
3. You are also ignoring the fact that the median family does not buy the median house. Lower earning people tend to rent, so the median house will be purchased by someone with above-median income.
#2 and #3 are why I already explained, in my comment to you as well as a previous comment in this thread, that the absolute values of these ratios can’t be analyzed in the way you are trying to do; it’s the changes in the ratios that matter.
Thanks Rich. These are
Thanks Rich. These are great….I think the only other factors are unemployment and/or confidence. it would be interesting to see the sequence of events. Thanks for your graphs and your insight.