Below you will find updated charts showing how San Diego home prices
(and, further on down, monthly payments) stack up against local
incomes and rents.
Longtime readers know that I consider the price ratios to be
absolutely fundamental to determining whether housing is fairly
valued. It makes intuitive sense that home prices would tend
to track incomes and rents: incomes, because they determine how much
money people have available to pay for housing; and rents, because
rent prices reflect how much San Diegans are willing and able to pay
to put roofs over their heads when there is no speculative or
investment element involved. The historical record bears out
this intuitive logic, as San Diego’s home price-to-income and
price-to-rent ratios have tended to be strongly mean-reverting over
time.
Of course, there are other factors to take into account, such as
employment trends, rates, and divergences between the various
sub-markets that make up the aggregate numbers. But these
ratios represent a good starting point in determining where the
market stands from a valuation standpoint.
The first chart shows the ratio of the typical San Diego single
family home to San Diego per capita income. (Median household
income would be better but there’s less data available — however,
having charted the data that is available, there is actually very
little difference in the ratios whether they are based on household
or per capita incomes). The price to income ratio is in blue,
with historical mortgage rates charted in gray to provide context,
and the historical median price to income ratio (what we might
somewhat simplistically designate as “fair value”) in red.
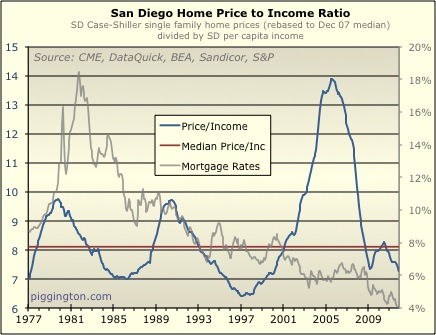
After the stimulus-driven bounce out of early 2009, the price to
income ratio has declined to 7.3. This is a new post-bubble
low, and is 10% below the historical median.
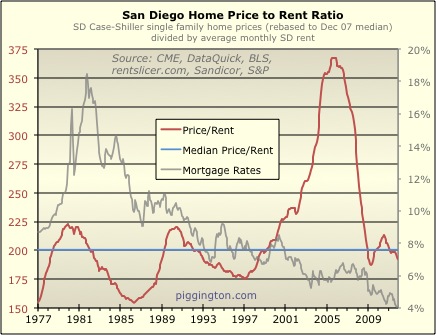
The next graph shows the ratio of the typical single family home
price to average San Diego rent. The price to rent ratio sits
at a more modest 4% below its historical median.
San Diego homes, then, are undervalued in aggregate based on these
ratios. But not dramatically so. The following table
lists the extremes in these price ratios in the three real estate
cycles that have taken place since the 1970s:
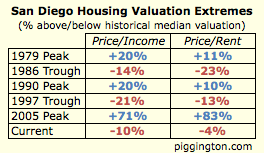
We can see here that, despite the comparative vastness of the most
recent boom, neither the price to income nor price to rent ratio has
fallen as far below the median as they did in the two prior
busts. Of course, there is no guarantee that they will do so,
especially since the government is supporting housing to an
unprecedented degree. But given the tendency for overshoot
along with a raft of challenging economic considerations — shadow
inventory, weak employment, and a potential interest rate shock
spring to mind — I think the odds are fairly good that these price
ratios will decline further still. (Whether that translates to
significantly lower nominal home
prices is up for debate, but that’s another topic entirely).
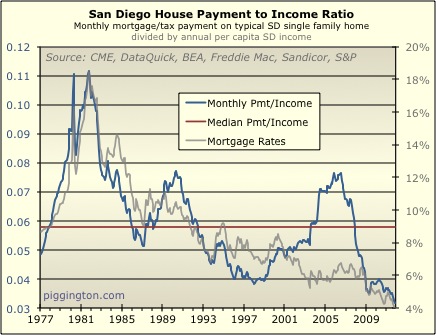
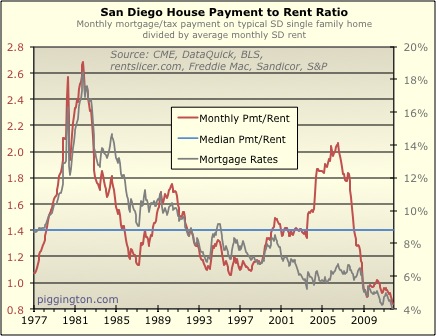
Changes to the monthly payment-based ratios, which measure the
monthly payment on the typical house against incomes or rents, have
not been quite so subtle. Slightly below-average valuations
have combined with absurdly low interest rates to produce payment
ratios that are easily at all-time lows since the data
started. The payment to income ratio and payment to rent
ratios are, respectively, 45% and 40% below their historical median
levels:
As I am always careful to point out, the price-based ratios are far
more important than the payment-based ratios in determining whether
homes are fairly valued. This is because the impact of rates
is, unlike those of incomes and rents, ephemeral and
undependable. However, in certain situations, individuals who
are considering a home purchase may be more interested in the
payment ratios. I discussed this distinction at length in a voiceofsandiego.org
article early this year, so I won’t rehash it here.
Readers should note, however, that both price- and payment-based
valuation ratios have improved since that piece was written, further
moving the dial towards a home purchase making sense under certain
conditions.
Shamble on…
Thanks Rich for the update.
Thanks Rich for the update. Although I’ve looked at these graphs many times before, a few things just dawn on me.
1. We’re w/in a few % from the last two bottom for price to income.
2. Mortgage to rent is below 1, not just the long term average of 1.4. If you’re a buyer who want to stay in your home for a long time, your monthly payment vs rent is the best since 1977 (that’s where your data started). To me, that’s a BIG buy signal. If you have the cash to down for a house, it’s finally cheaper to buy than rent a typical SD SFR (it has never been this way since 1977).
3. The monthly payment of this last peak is actually not the highest since 1977, even though the nominal price is. Around 81-82, the monthly payment to rent was actually ~30% higher.
4. Rate rise around the bottom of 86 and 97. When rate rises after the last two crash, price actually rises, not crash further. My instinct is telling me that if we see rate rises sometime after today, we might see a price increase instead of decrease. We’ll have to wait and see if my instinct is right or wrong.
AN wrote:
4. Rate rise around
[quote=AN]
4. Rate rise around the bottom of 86 and 97. When rate rises after the last two crash, price actually rises, not crash further. My instinct is telling me that if we see rate rises sometime after today, we might see a price increase instead of decrease. We’ll have to wait and see if my instinct is right or wrong.[/quote]
I’ve read this observation before. I wonder if it would be different this time (higher interest rates causing prices to drop) because rates were (are) artificially low this time.
Not sure how or why that would or wouldn’t affect it. But what if the government stops artificially lowering interest rates, and they rise to where they would be naturally? Still low, but higher than they are now. There would be an increase in interest rates without the usual causes of increases in interest rates. And such causes might normally also cause the average home buyer to be able to pay more per month. So, if interest rates rise but there isn’t the usually coincident rise in ability to pay, prices might be adversely affected.
The above could all be rubbish, as I don’t very well understand interest rates and why they go up or down. It’s more of a question for people who do understand it.
I think you are exactly right
I think you are exactly right zk… it all depends on the cause of the interest rate increase. If rates are increasing as part of an economic rebound, as they often do, the positive effects on home prices could outweigh the negative effects of higher rates. But if they are rising for other reasons (fear of default, inflation, or just because they were too low to begin with), the usual positive factors might be lacking.
I don’t disagree with you
I don’t disagree with you guys that it could be different this time. I was basing my instinct on what has happened in the past. WRT to fear of default, didn’t we already have that when our credit was downgraded? IIRC, mortgage rates actually went down when we were downgraded. Same with the fear about Europe right now. Rates are dropping today with all the fear from Europe default.
Didn’t we see stagflation in the 70s, where real economic growth was basically flat and inflation was high? IIRC, rates sky rocketed and so did nominal housing price. To me, a deflation (& lowering of rates) would more likely take down price than inflation (& rising of rates). With the fed keeping rates at 0% and government doing all they can to prop up housing price. Even when food and energy inflation is going up, the official CPI # is pretty anemic.
WRT to rates just being too low to begin with, haven’t we been too low for a long time now? Isn’t historical average is around 8%? If it is, then we’ve been too low for well over a decade. What would make it different this time that would rates to go back up without economic growth and/or inflation?
I don’t know the answers to a lot of these questions, but I’m just talking out loud, hoping to either be proven wrong (with data) or confirming my assumptions.
AN wrote:WRT to fear of
[quote=AN]WRT to fear of default, didn’t we already have that when our credit was downgraded? IIRC, mortgage rates actually went down when we were downgraded[/quote]
You answered your own question… the fact that rates went down shows that there was no actual fear (of default) in the market. You’ll know it if and when that happens.
[quote=AN]What would make it different this time
that would rates to go back up without economic growth and/or inflation?[/quote]
The aforementioned fear of default would be one thing. Foreign central banks dumping their Treasuries if they decide to break their currency pegs is another. A general flight out of dollar-denominated assets would be a third.
When it comes to rates, this time IS different in the very small timeframe you noted — that is, it is different from the previous real estate cycles from the past few decades. But this time is NOT different in terms of govt debt problems throughout history. We have pretty much all-time low rates, along with an all-time high level of peacetime indebtedness and deficit, a complete lack of willingness to do anything about it, and a central bank whose solution to everything is to print money.
The people who don’t think that this piper will be paid at some point are the ones who seem to think that this time is different from the grand sweep of history.
Thanks for the update
Thanks for the update Rich.
The last chart is a landlord’s wet dream.
FormerSanDiegan wrote:Thanks
[quote=FormerSanDiegan]Thanks for the update Rich.
The last chart is a landlord’s wet dream.[/quote]
Yep, totally agree.
peacetime?
Not that I blame
peacetime?
Not that I blame you for not realizing we have two wars in the middle east, a war on drugs, and a war on terrorism given the quality of our media, but I am somewhat cautious in taking a history lesson from someone who would call this peacetime in their economic analysis. While I am not Bush bashing here, unfunded wars do have consequences. In a Keynesian, fiat currency system (which is what we have) it is the governments role to provide counter-cyclical stimulation to smooth out boom bust cycles. That means print money now, and increase revenue during growth.
JGP wrote:peacetime?
Not that
[quote=JGP]peacetime?
Not that I blame you for not realizing we have two wars in the middle east, a war on drugs, and a war on terrorism given the quality of our media, but I am somewhat cautious in taking a history lesson from someone who would call this peacetime in their economic analysis. While I am not Bush bashing here, unfunded wars do have consequences. In a Keynesian, fiat currency system (which is what we have) it is the governments role to provide counter-cyclical stimulation to smooth out boom bust cycles. That means print money now, and increase revenue during growth.[/quote]
Poorly phrased by me, I will admit. Obviously I meant that it was the highest debt except during wartime, not that there was no war going on now.
Obvious, at least, to people who aren’t trying to score cheap debate points.
In any case, your belief (stated as fact) that “it is the governments role to provide counter-cyclical stimulation to smooth out boom bust cycles” doesn’t actually have anything to do with my point, which was that we have a huge amount of debt.
Do you deny that we have a huge amount of debt? Specific to my post, do you deny that we have more federal debt as a percentage of GDP than at any time since a very brief period at the end of WWII (which, incidentally, represented a far bigger mobilization of national resources than the current wars)?
If not, what’s your point, exactly?
gotta back my brother Rich on
gotta back my brother Rich on this one, “war on drugs?” really? do not confuse the word “war” with an actual war. If you want to classify the war on drugs as a war that can be used to put economic cycles into perspective, you need to get some data. That “war” has been going for decades and we spend less on it today (inflation agjusted) than we have in the past. In fact, you can say the white flag has been raised already in that war, minus some legal wrangling.
For purposes of economics, “wars” are real wars, wars with tanks. Not wars on crime, wars on hunger or any other wars. Wars cause temporary econmic spikes in where our resources and people go. The middle east is drawing to a close, it is absolutely a factor in the near term economics of a county with a large military presence, like San Diego. It also affects housing, ask any large apartment complex owner about cycles related to past deployments.
Now back to your regularly scheduled program, Rich’s graphs tell a tale as long as you are not looking through tinted glasses. Rich is a locally famous housing realist, often confused with a housing bear. So many outliers to the last boom (aka piggington bloggers) are actually buying houses right now, some are buying more than one. They are doing so because of fundamentals like those rich has charted for years. The SD and OC median recently fell about 6% YOY, while riverside and san bernadino rose or stayed the same during that same period.
http://www.signonsandiego.com/news/2011/dec/13/home-prices-fall-6-november/
Riv and SB counties fell first and fell harder, SD and OC fought it off longer but the Bugs butterfly effect is clearly visible now. 8th inning is upon us, the holdouts will reach equilibrium in the next year, stability and affordablity will return and the start date of the next cycle will be delayed by the collective bad taste that will take a little while to be washed out of the sheeple’s mouths. The masses didn’t pay attention to fundamentals before, this will be no different. But it will turn, it has turned, if you look at the charts.
I’ll leave you with this thought, 6 years ago, Rich’s graphs told a story that could not be found in the media. But that story was not a story of the past, it was of the future. Values were way above historical norms. Most of us here back then paid attention to what he wrote and most of us will be eternally grateful. Today, those same charts tell a different tale, depicting numbers at or below historical norms. It comes as no surprise that some people will ignore them because they contradict commonly held beliefs, beliefs that are backwards looking. Just like before.
delete
delete
Rich,
I don’t think that
Rich,
I don’t think that interest rates (at least those determined by the Federal Reserve) CAN rise. The last few Fed statements have confirmed that federal funds rates will stay low for an “extended period” of time. What must be understood is that at a $15tn national debt, each 1% increase in rates adds another $150bn to the national deficit, which is thereafter compounded. The federal reserve has put itself into a straightjacket.
In other words, the United States could not meet its funding needs without interest rates where they are now. Increases in rates would cause a funding crisis, as evidence suggests with Italy and other European sovereigns that when the government bonds reach a certain interest rate (6% for Italy), government cash flow reaches a point of no return, and default is inevitable.
As I have said on this blog before, the only option for our central planners is to print. This is the ONLY possible outcome for our country. Math is math. Period.
Buy that house, and pay as little down as you can. Put the rest in gold.
lifeizfunhuh wrote:Rich,
I
[quote=lifeizfunhuh]Rich,
I don’t think that interest rates (at least those determined by the Federal Reserve) CAN rise. The last few Fed statements have confirmed that federal funds rates will stay low for an “extended period” of time. What must be understood is that at a $15tn national debt, each 1% increase in rates adds another $150bn to the national deficit, which is thereafter compounded. The federal reserve has put itself into a straightjacket.
In other words, the United States could not meet its funding needs without interest rates where they are now. Increases in rates would cause a funding crisis, as evidence suggests with Italy and other European sovereigns that when the government bonds reach a certain interest rate (6% for Italy), government cash flow reaches a point of no return, and default is inevitable.
As I have said on this blog before, the only option for our central planners is to print. This is the ONLY possible outcome for our country. Math is math. Period.
[/quote]
I completely agree with your point on debt service costs and what would happen if rates were to rise to “normal” levels. I also agree that this makes it likely that the Fed would try to fight it with money printing. But:
– Who knows when they’d start or at what level of rates.
– It’s not all that easy to control markets even when you have a printing press, so maybe they would not succeed.
– The printing would cause problems, and at some point they could be deemed to be worse than the problems caused by high rates.
So I don’t know exactly where the pain will show up, but I do think that higher rates are a risk. That said, I am largely in agreement with what I quoted above.
AN wrote:
4. Rate rise around
[quote=AN]
4. Rate rise around the bottom of 86 and 97. When rate rises after the last two crash, price actually rises, not crash further. My instinct is telling me that if we see rate rises sometime after today, we might see a price increase instead of decrease. We’ll have to wait and see if my instinct is right or wrong.[/quote]
The question is which leads the other?
Interest rates are being held down now to keep monthly paments affordable at current valuations; in theory if they rose that would decrease affordability and drive prices down. But previous rate rises have coincided with price increases, which is contrary to that idea.
But maybe the relationship works the other way round. Looking at in in reverse, home prices rising raises the CPI, triggering the Fed to raise interest rates. Will the Fed have to raise rates in response to other inflationary factors before home prices begin to rise? What would that do to home prices in a struggling economy? We’ll see soon enough.
Thanks for the great data and
Thanks for the great data and write-up, Rich,
Very timely.
The payment to income ratio
I had no idea! This sure makes a good case for putting less money down, but then the question is where DO you put your cash? Stocks? Bonds? A business? There sure is a lot of perceived risk out there.
For me, I hate the idea of taking on any amount of debt. That is, however, looking like the best option.
Rich – Is this the start of
Rich – Is this the start of the “Housing Trough Analysis and Statistics Site”
It would be interesting to
It would be interesting to overlay an unemployment graph over the first graph (San Diego Home Prices to Income Ratio)
One man’s affordability is
One man’s affordability is another man’s cheap credit …and that party ends in tears as David Cameron was reminded by a knee in the groin from Merkel.