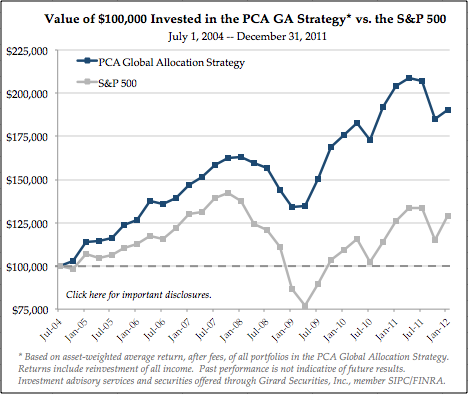
My company, Pacific Capital Associates, has recently completed the
third-party examination of our investment track record for
2011. (For background on this, see my inaugural explanation
of these annual performance updates). Here it is, in chart
form… you can click on the chart for more detail and loads of fun
disclosures:
2011 was a tough year for us. We were and still are
invested in several areas that got whacked, including foreign stocks
(which have much better valuations than US stocks, in aggregate) and
gold mining stocks (which we believe are extremely
undervalued). Meanwhile, despite the 12% decline in
international stock markets, the US stock market — which we are
underweight due to concerns about overvaluation
and risks from our debt
situation — was one of the few asset classes to post positive
returns. And US Treasuries, on which we are strenuously
bearish, were the best performing asset class for the year.
All in all, our average managed account was down 6.99% after fees
while the S&P500 was up 2.11%.
So it goes for value investors, as markets can move against the
fundamentals for protracted periods before finally coming around (I
recently put up an interesting
chart on that very topic). Despite 2011’s performance,
our long term track record remains intact, with our average managed
moderate growth account having returned 8.9% per year after fees
(5.5% per year better than the S&P500) through year-end
2011. Bouts of underperformance are part of the value
investing game, and we feel very confident that our approach will
work out in the long term, which is the time period that we care
about.
As always, comments are off for compliance reasons. Feel free
to contact me at rtoscano![]() pcasd.com if you have questions.
pcasd.com if you have questions.

