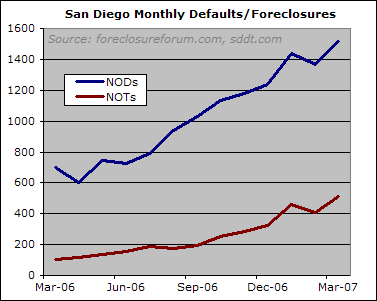
Here’s a quick graph of March NODs and NOTs. I won’t be able to put this into proper historical context until I get March labor force info and DataQuick sales volume. However, I wanted to put up a graph of the past year’s data to demonstrate the shocking conclusion that foreclosures are still on the rise.
Shocking indeed.
Shocking indeed.
Thanks Rich. Lovely data for
Thanks Rich. Lovely data for the current renters. Keep it coming and falling.
it is shoking
it is shoking
It’s interesting to see how
It’s interesting to see how the two lines are becoming more in sync with each other now that many of the “bail out” methods of years past are no longer a viable option for many (ie. refi’s, selling, etc.)
From before… But how many
From before… But how many motivated sellers is “too many?”
Apparently motivated sellers are meaningless. You see, due to the hot market in 2003-2004, future demand was “pre-met” that’s why the slow sales volume isn’t pushing prices down. I don’t know what kind of babble-logic saying future buyers bought two years ago that’s why the lack of buyers isn’t creating downward pressure is, but I’m sure there’s plenty of people gladly nodding their heads.
“Slow sales usually create downward pricing pressure. One reason they haven’t, DataQuick President Marshall Prentice speculated, is because the 2003-to-2004 boom essentially “borrowed” from future purchases as people stampeded into the market. Current demand, in other words, was “pre-met.”
”
DQ Babble