Well, better late than never, I guess, for this month’s resale data roundup.
We already saw that the size-adjusted median held up pretty well in comparison to the drubbings inflicted in recent months. It was down 1.1% for single family homes, which isn’t great but is a lot better than December’s 4.6% smackdown. And it was actually up for condos, by 1.3%.
From last January, however, this price measure is down by about 14%.
Here’s a longer term view from the series peak in September 2005:
As readers know, I like to look at the plain vanilla median each month not because it tells us much about what’s happening with prices, but because it tells us what mainstream analysts will think is happening with prices. This month, despite the reasonable behavior of the size-adjusted median, the vanilla median for single family homes got spanked for 4.0%. The condo vanilla median was flat.
Here’s a look at the median price change since a year ago.
Recall that the rise in the median price during early 2007 wasn’t a true reflection of price increases, but was due to the fact that low-end properties had stopped selling because the credit crunch had still only hit the subprime market at that point. What’s interesting is that the year-over-year median comparisons in the months ahead are now going to be compared against an artificially high year-ago value. So the vanilla median will probably start overstating the year-over-year price decline for the next 5 months or so.
Will the mainstream analysts pick up on this? Maybe… they seem to love the median when it’s understating price declines, but when it’s overstating price declines they often suddenly come up with all the reasons that you shouldn’t pay attention to it (which is completely correct, of course, except you shouldn’t have been paying attention to the median in the first instance either).
Here’s a look at the vanilla median since the aggregate series peak in November 2005. You can see that since the credit crunch spread out of subprime in mid-2007, the median has done some serious catching up and is now at least somewhat in line with the more accurate price metrics.
Finally, my estimated Case-Shiller HPI (which extends the latest HPI data, current to November, with the 3-month average of the change in the detached size-adjusted median), indicates that as of last month, single family home prices prices in aggregate had dropped by 22.7% from the November 2005 peak.
Sales volume continued to be pathetic, and was down over 30% from last year’s levels (which were themselves already fairly pathetic).
My two-year charts will now become 3-year charts. The orange triangle denotes January’s volume — January is always slow, but clearly not this slow.
Against this backdrop of declining sales, inventory has risen on a year-over-year basis despite the seasonally predictable month-to-month decline.
As the orange triangle shows, inventory was notably higher than it was in either of the prior two Januarys.
The months-of-inventory figure remained at its extremely elevated level of about a year’s worth of inventory waiting to be sold.
Our friend the orange triangle indicates that the level of supply relative to demand is much worse than it was in either of the prior two years:
I continue to believe that the rising inventory is due to the fact that an increasing number of sellers (in whose ranks I include lenders) no longer have the luxury of pulling their homes off the market to wait for better times. Not only is there an increasing amount of supply, in other words, but an increasing proportion of that supply is of the must-sell variety. And the following foreclosure graph shows that there is even more must-sell inventory waiting in the wings:
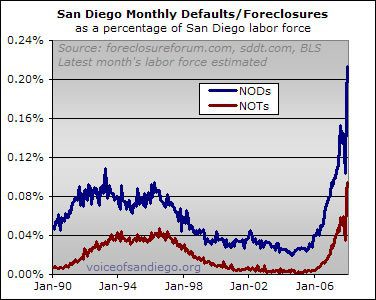
So, despite the one-month abatement of price pressure, the overwhelming glut of must-sell supply stacked up against meager demand strongly indicates that — for San Diego as a whole, anyway — there is plenty more downside to come.
Thanks Rich.
the
Thanks Rich.
the overwhelming glut of must-sell supply stacked up against meager demand strongly indicates that — for San Diego as a whole, anyway — there is plenty more downside to come.
Yes, that Case-Shiller chart seems to display it best.
Yikes!
Yikes!
As usual, awesome data
As usual, awesome data regurgitation/presentation/update. What’s your guesstimate on NOTs this year? More than 16,000? Oh my… that would lead to some interesting pricing…
Hi Rich,
Great data! I
Hi Rich,
Great data! I really like your final forclosure graph to give the historical perspective, but I find myself wanting to know the magnitude of the monthly pressure on price that forclosures are generating (since this is a monthly report). It seems that NOT’s/Sales would be that measure. What do you think?
BTW, these reports are the reason I keep coming back, even though I’ve moved away from SD. The smaller metro that I’m in has no one doing this kind of analysis. I keep thinking I may have to do it myself… but alas the skiing is too good to start now, and the mountain biking and climbing will be too good once spring hits…
Cheers, R
Great info.
Of course the
Great info.
Of course the NAR’s take on the national decrease is less activity at the higher price levels – because prices can never go down.
Eventually we will see a random month-to-month increase in the median at which point the perma-bulls (awfully quiet these days btw) call the bottom and thumb their noses at the bears only to be proven wrong when it takes another dive. Of course they will use the median when noting the increase but the CS HPI to minimize the price drop.
Thanks for the kind words,
Thanks for the kind words, y’all.
davelj, I haven’t formed a guesstimate of 2008 NODs. But they could sure be high. First, we have more NOD’s likely coming as risky mortgages reset. But worse yet, we have a lot of NODs piled up that haven’t even turned to NOTs yet, but will do so in all likelihood. By coincidence ocrenter has a piece up today on how long it’s taking some NODs to get thru the pipeline.
rockclimber, I agree and actually intend to update the sales-to-NOD chart shortly. (I was using NOD because it’s less volatile and also more predictive because it happens earlier). Background can be found here and recent update here.
Hope everyone has a great week.
Rich