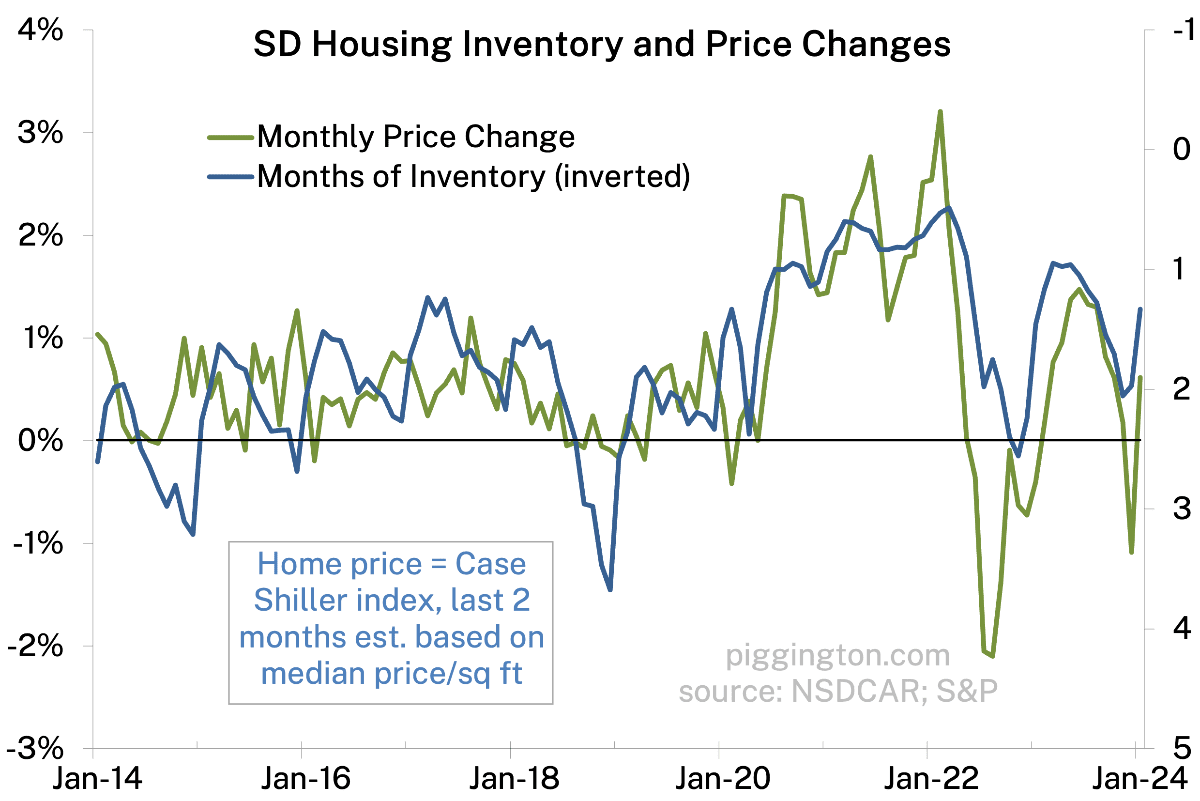
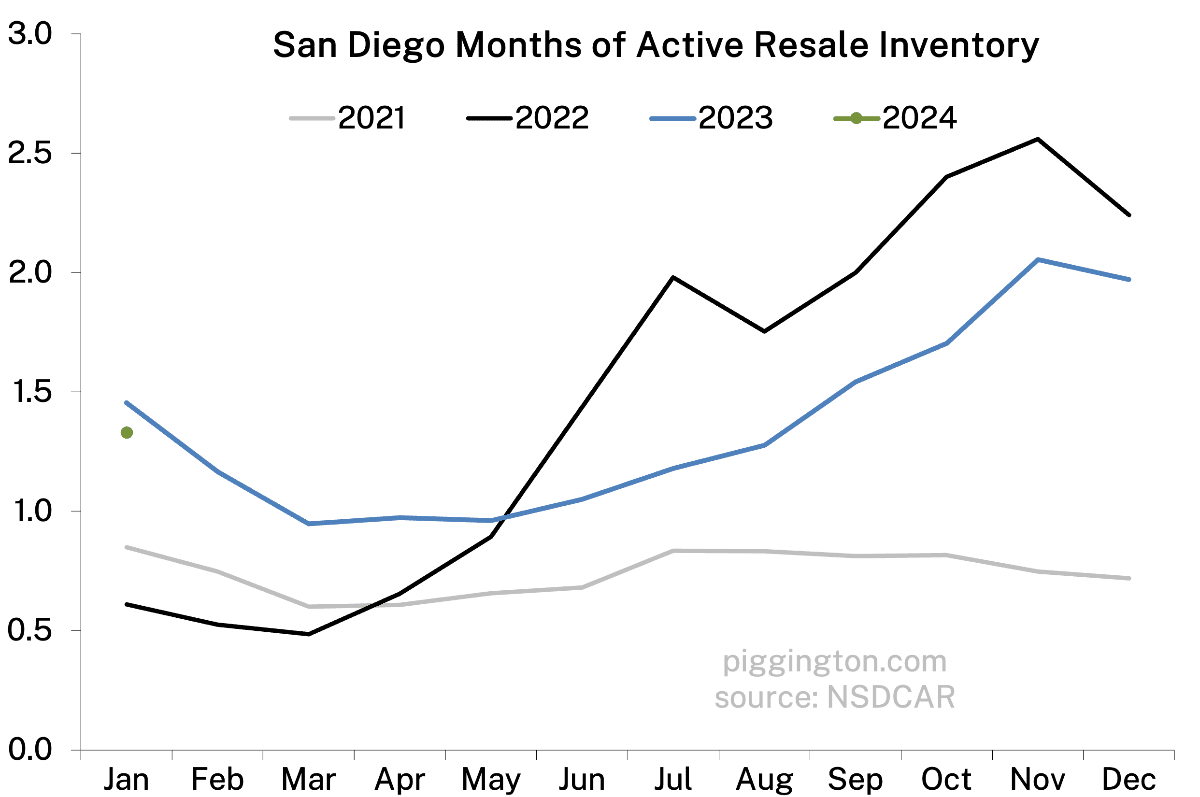
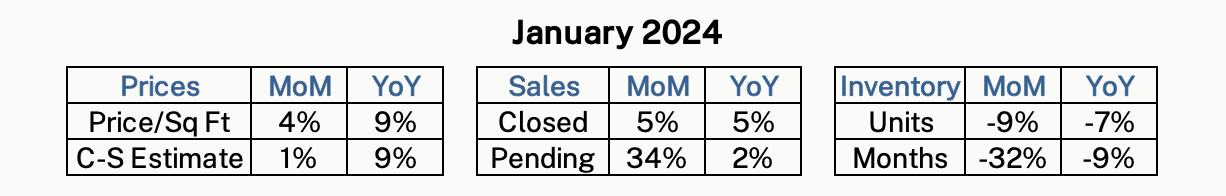
The typical year-end drop in inventory took place, and prices popped, pushing this typically tight relationship more in line:
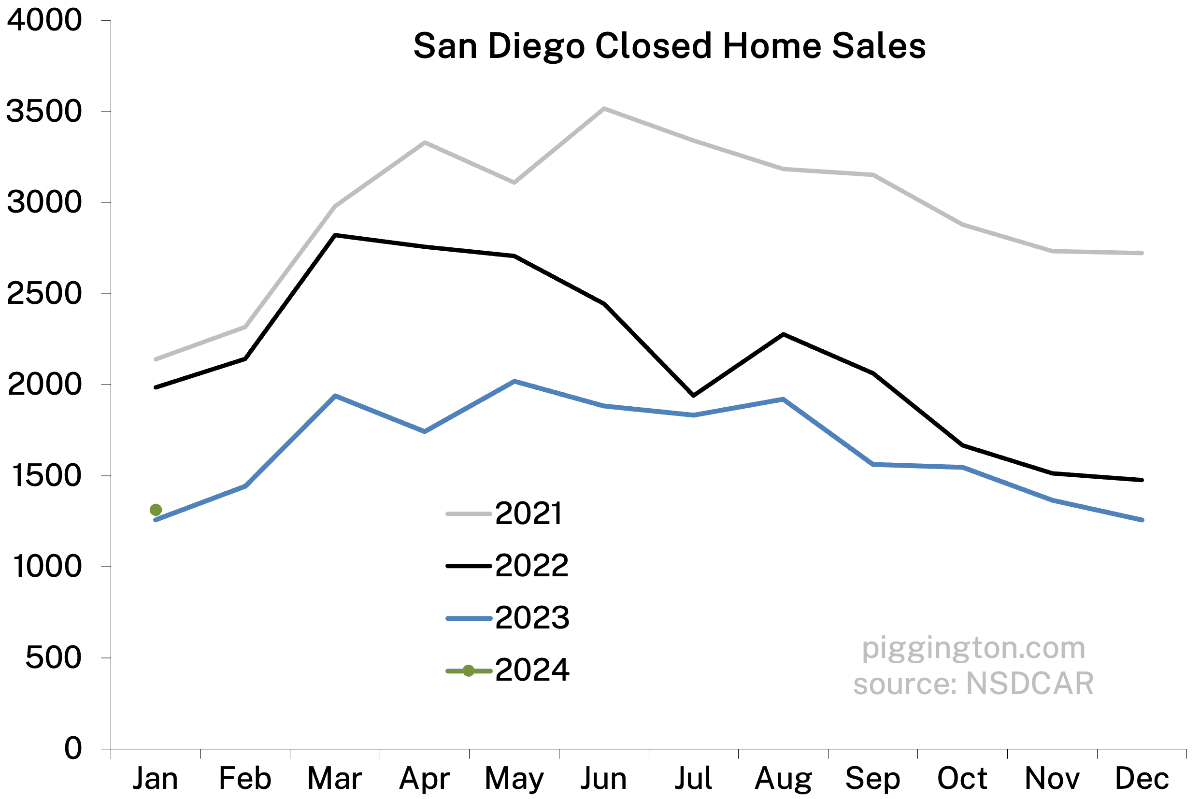
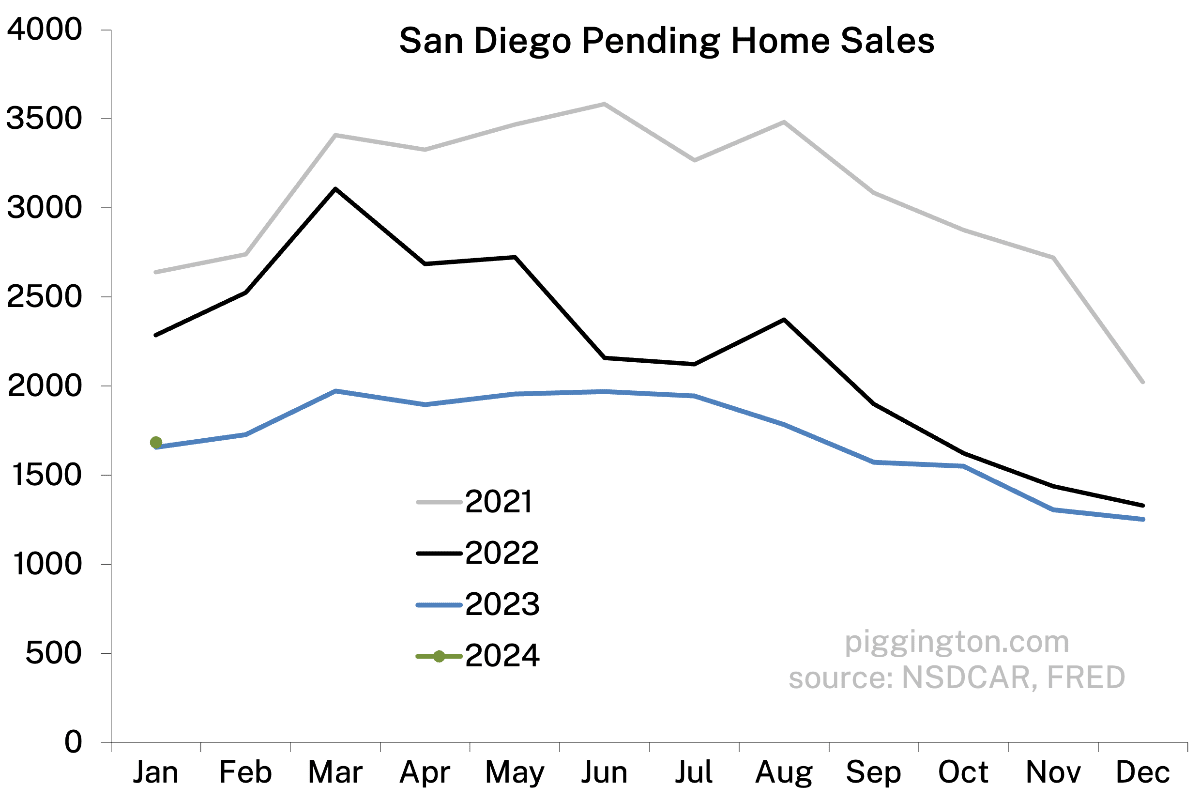
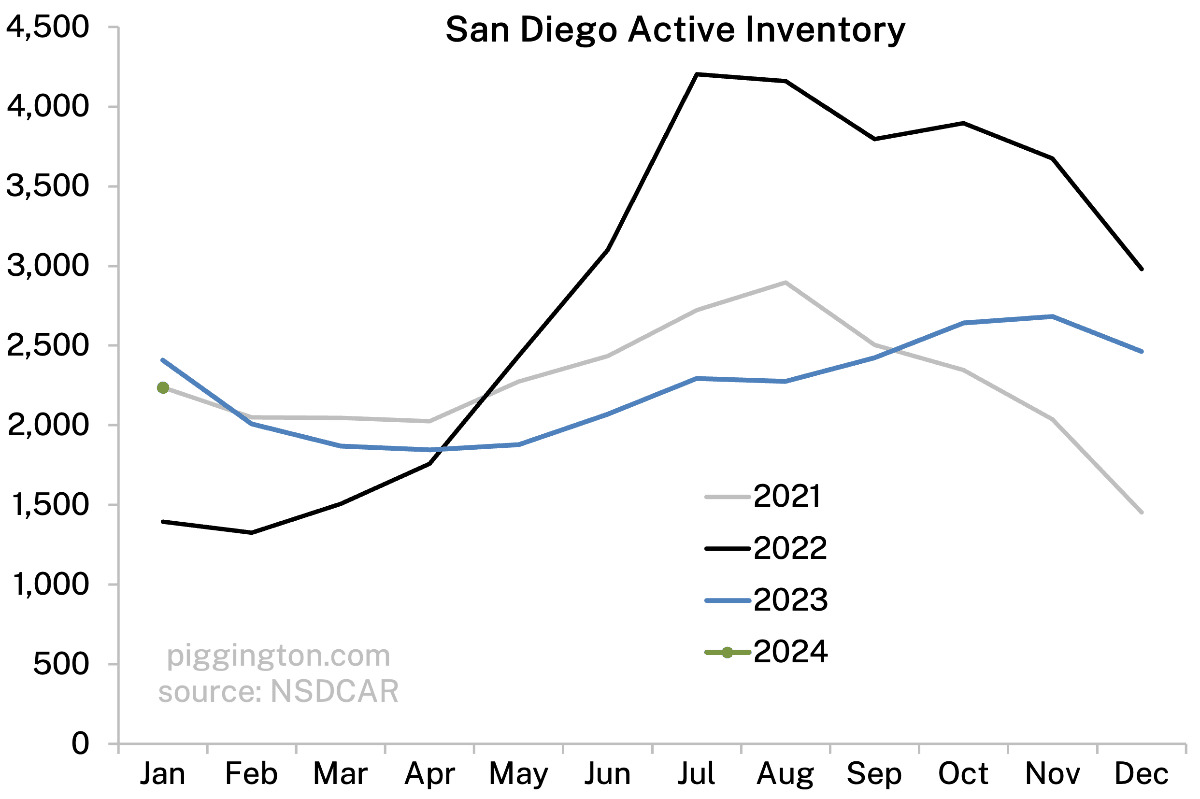
 Looking at the month by month graphs, it’s kind of amazing how similar January 2024 (the green dot) looks to January 2023:
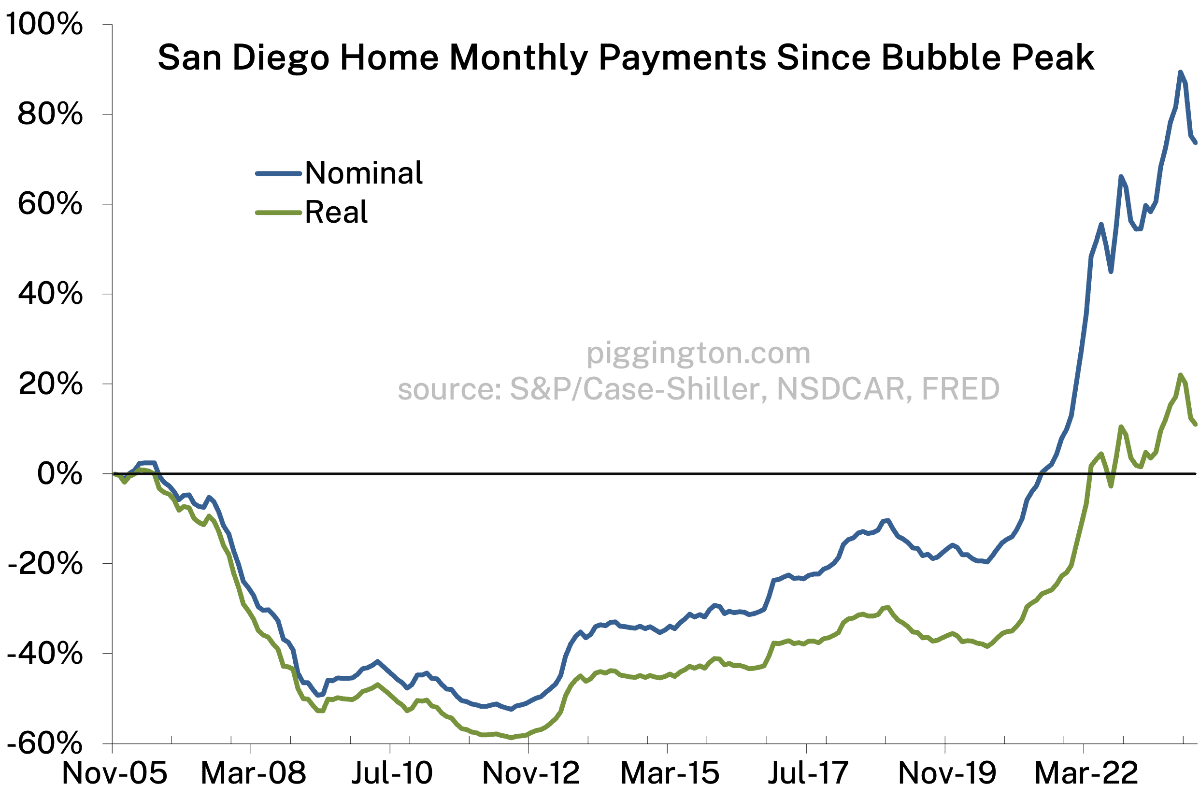
Rates have been coming off the boil (well not today, but in general), but they are still above last January’s levels. That said, monthly payment affordability has improved a bit from last year’s levels:
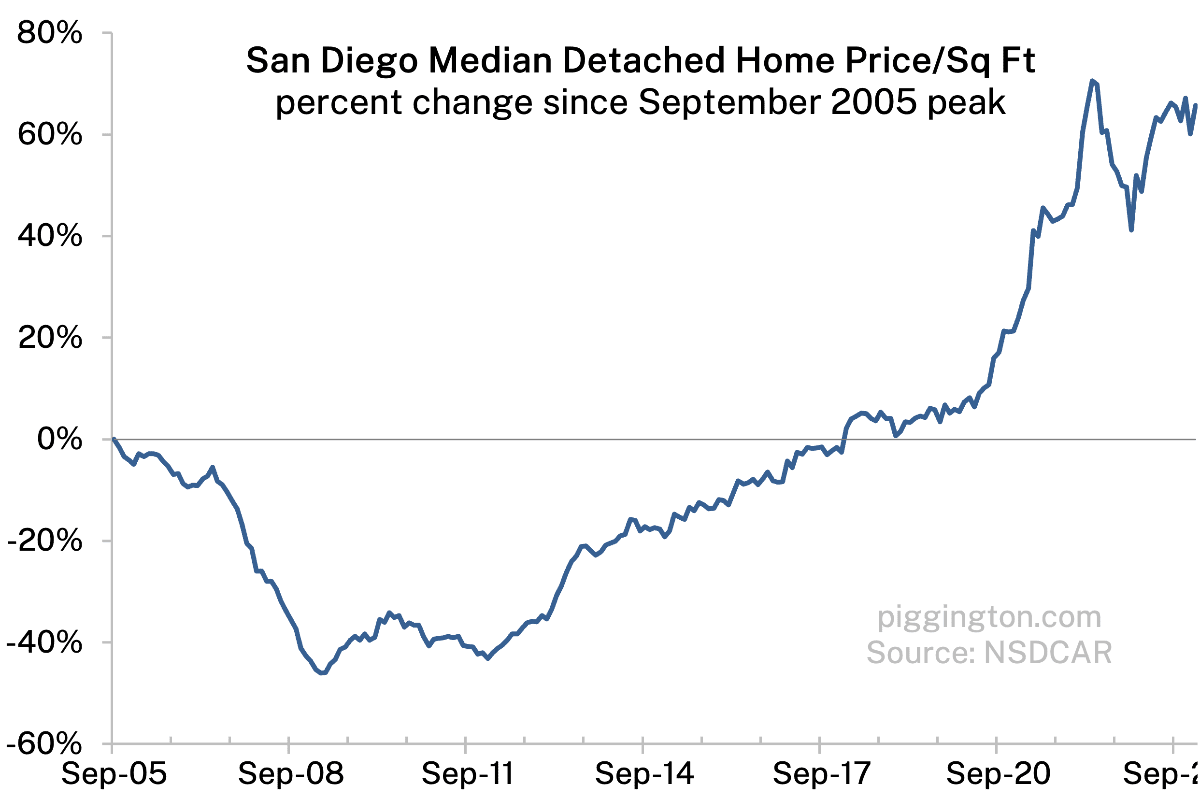
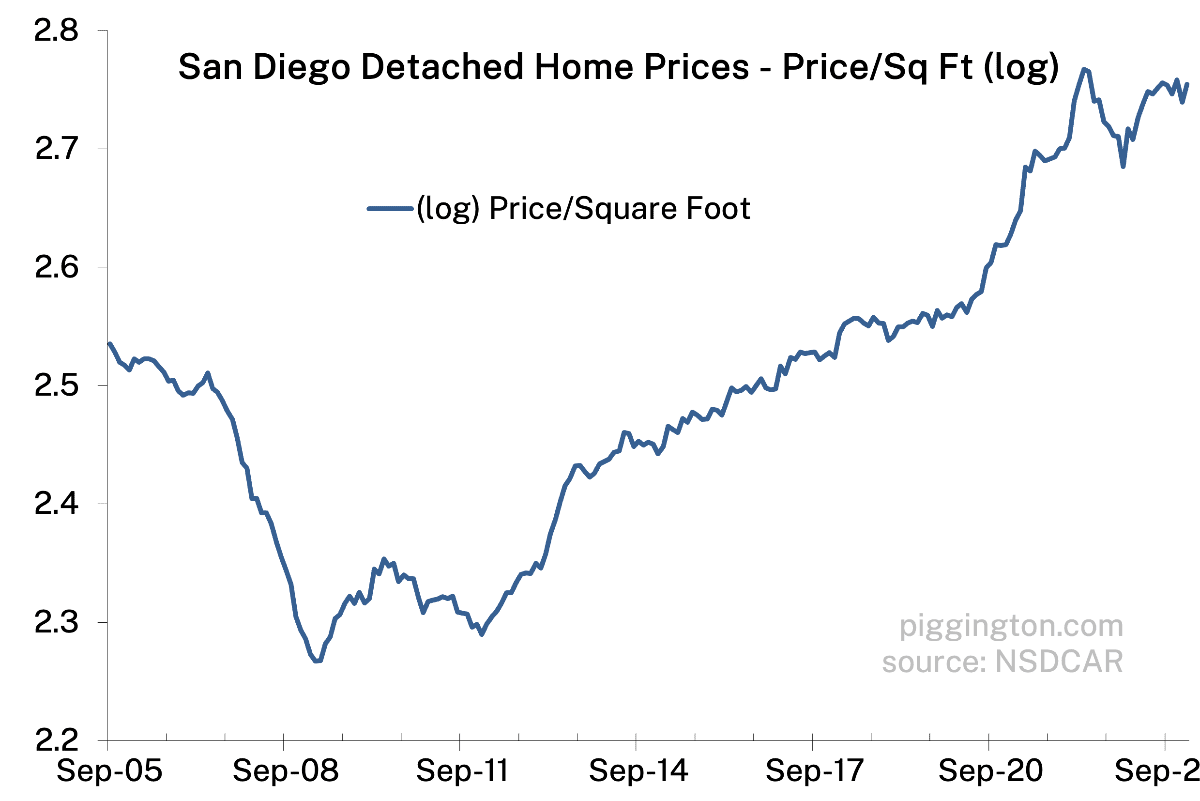
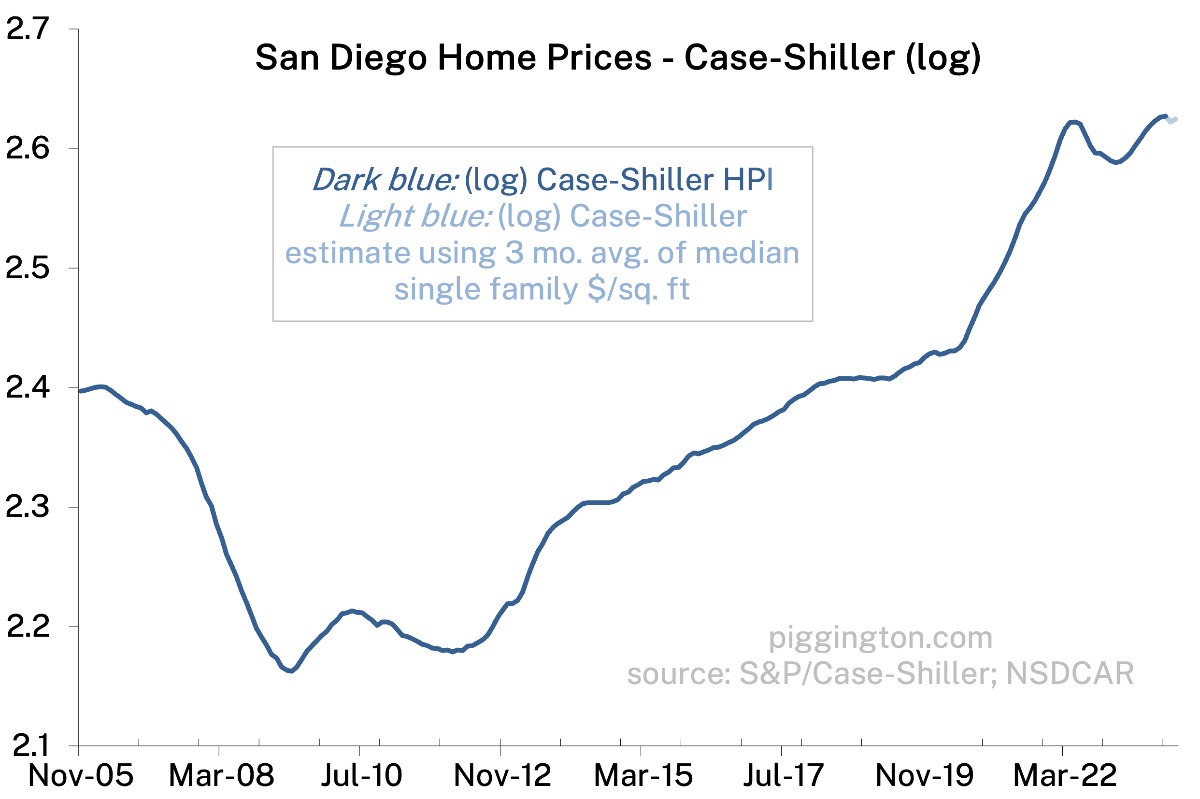
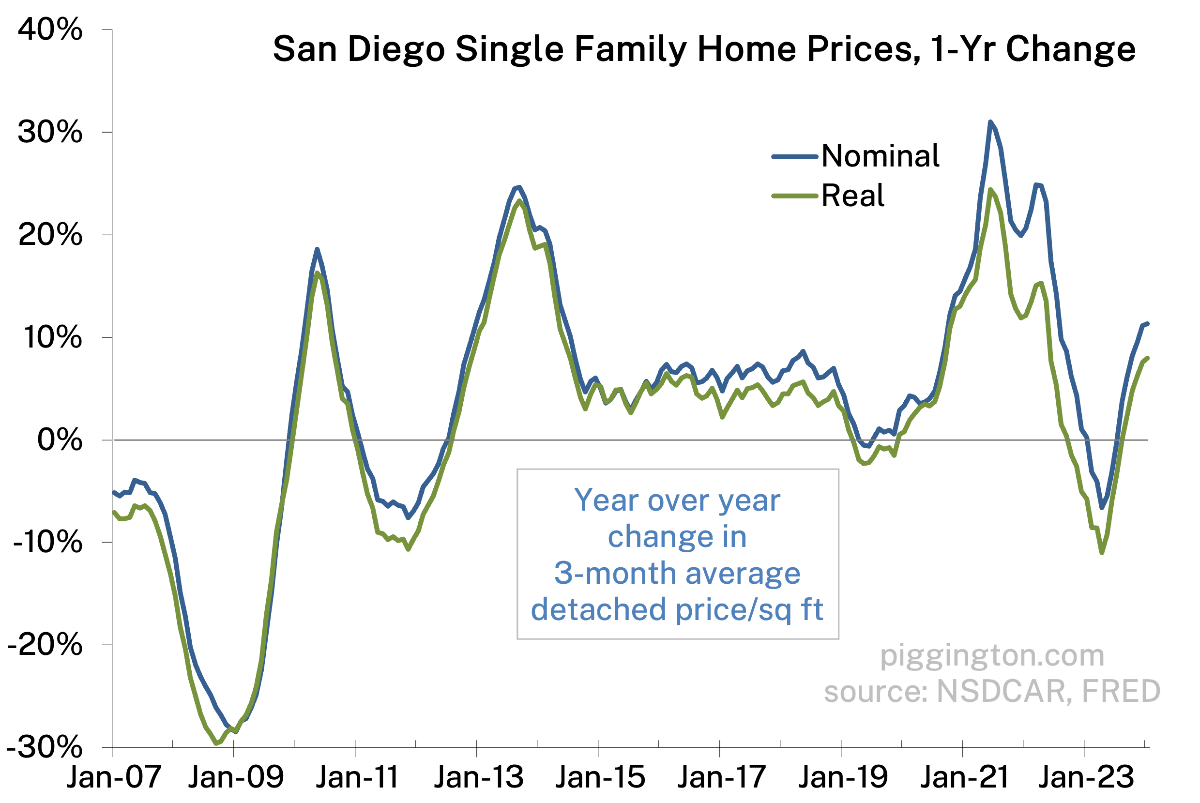
We’re now in year 2 of prices going nowhere, or somewhat down in inflation-adjusted terms:
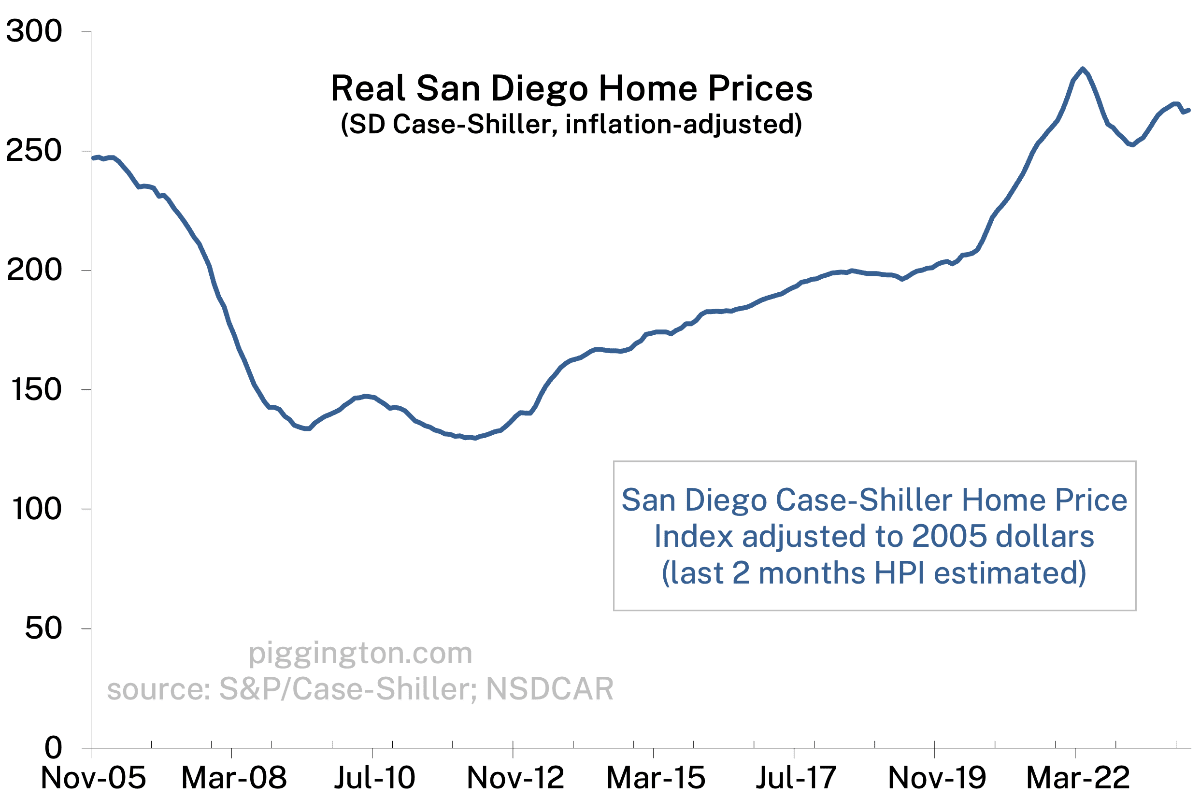
I continue to think it’s reasonable to expect that last graph to keep meandering downward. I’ll touch on that more in the next valuation update, but for now, my views as of the last valuation update haven’t changed much.
More graphs below…


Got a request for you Rich if not too much trouble. The biggest story in RE continues to be the extremely low volume of homes being put on the market. Posting the inventory data for the last few years shows the relative changes of late but really misses out on what is most important from a historical perspective. The SoCal housing economist I follow has taken to always including a pre-pandemic 2019 inventory line which puts it all in perspective. Until we get back to listing volume and inventory levels like back then we are in for a very very sluggish market here.
Hmm… I like it. I assume you’re talking about the ones that compare month by month. I’ve always limited the number of years on those because they get too cluttered otherwise. But I could do a pre-pandemic average, say average values for 2015-19, and put that avg as a single line on there. I will put that on the to-do list.
In the meantime this one puts it in perspective, though it doesn’t do the monthly comparisons.
Thanks and yes the monthly graphs are the ones I was referencing. On the graph you linked a crudely drawn regression line would fall around 5500. The current level on that line is less than half of that. It is half of what it was in a growing area. Lending has gotta to have been hit even harder.
If you could add a historical average line of some sorts in it would really show that very clearly