In the comments to the prior post a graph of the sales-per-trustee-sale ratio was requested. Here it is:
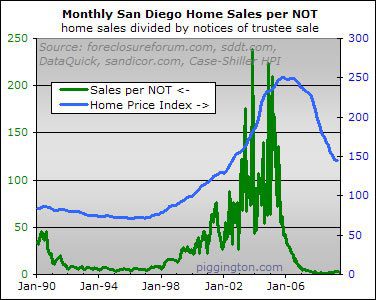
There is so much variation twixt boom and bust that it’s impossible to tell what’s going on in the current depths. So let’s have a look at the same thing with a log scale:
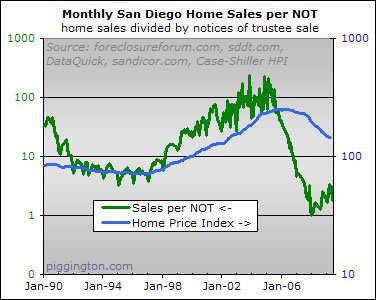
As with the sales-per-NOD ratio, we are below 1990s levels.
Here’s a look at sales-per-NOD and sales-per-NOT overlaid:
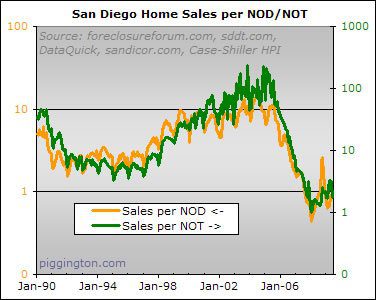
Sales-per-NOD lead sales-per-NOT, as you’d expect because the former happen before the latter. But other than that (and bearing in mind the differing scales), the trends look pretty similar.
How would short sales fit in
How would short sales fit in here? Those would fall most likely in the sales per NOD wouldn’t they. And they’d avoid the NOT in some cases…
Yes… that’s why I think
Yes… that’s why I think sales per NOD is a better measure of market stress. But as DWCAP said in the other thread, the more data the better.
Rich
sorry rich,
I had no
sorry rich,
I had no intention of making you do more work. I ment the ‘more is better’ in that there is always another angle to look at the data from. Eventually you need to just trust that you have a good picture and itll never be perfect.
If nothing else, you can show that sale/NOD is a very good metric to be using, as apposed to sale/NOT. On a log scale those are nearly indngushable.
I am alittle supprised though, i would have thought short sales were a bigger facter than they seem to be.
A big thanks for the extra effort.
Being new to this, what is
Being new to this, what is the implication of this graph where Sales/NOT (or NOD, if you choose) is low?
Nevermind: I read the article before and got the gist of it:
“The chart clearly shows that a low sales-per-default ratio has traditionally accompanied falling prices, and vice versa. The chart also shows that we aren’t very far off the all-time lows for the ratio.
For all the relief that the spring-summer rally has brought to the real estate bulls, it seems a bit premature to uncork the champagne before that orange line climbs out of the abyss. That’s all I’m saying.”
Thanks!
Heh heh, no problem DWCAP —
Heh heh, no problem DWCAP — you were right, it was definitely worth taking a look at.
rich
This data is exactly what I
This data is exactly what I am very curious about. Thank you Rich for getting it.
It really surprised me that the patterns kind of went hand in hand with the NOD data (given the market manipulations/interventions from different forces). To me, it adds more information for the belief of the shadow inventory’s real existence. I often doubted the strong connection between NODs going to NOTs for the majority of homes because there are so many things that can happen in between NODs going to NOTs. A small example, a while ago, I hear a bunch of personal stories of intentional stop payments in order to talk with the banks. Some of these people weren’t really interested in going through the whole foreclosure process, they just hoped to negotiate with the banks. So those NODs number may or may not ever get to NOTs. Of course, it’s always only a fraction right? But if enough of those NODs occur, it could become a factor in overestimating the effect of NODs on the housing market.
My 2 cents.
The glaring issue here is
The glaring issue here is that a large percentage of homes that are issued NOT’s don’t ever have a TS.
In the ts’s I have attended (quite a few now), typically, less than half of the schedule properties are put up (for a sale or repo). I would venture to say less than a third.
Further, many get pulled off the ts schedule prior to the date of the ts.
While I would agree that NOD is a better measure of sheer stress and borrower sentiment (or desperation or calculation or whatever), it seems pretty de-coupled from repossession action.
As an agent, I know that a bank is dramatically more likely to work with a borrower who is more than 4 months unpaid.
For banks, it seems NOD really equates to more of a measure of seriousness (in the borrowers desire to re-negotiate the lending contract) than anything else.
If I’m reading this
If I’m reading this correctly, it looks like there are roughly 10 NOD’s for every NOT. Am I reading this correctly?