Based on their historical relationships with rents and incomes, San Diego home prices are now reasonable.
There. I said it.
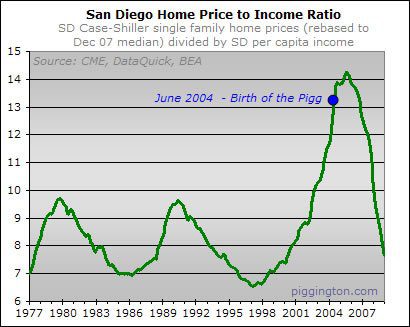
The long-term price-to-income and price-to-rent graphs tell the tale:
Neither ratio is at its all-time low, but both are firmly in the middle of the range that prevailed for two decades before this latest bubble blew the valuation metrics sky-high.
The price-to-income ratio would have to fall 15% from December’s level to equal its all-time low hit in 1997. The price-to-rent ratio actually hit its low in the prior cycle, in 1986. It would have to fall 22% from here to hit that level. Of course, given the exaggerated bubble-time overshoot to the upside, it’s reasonable to believe that valuations could overshoot to the downside and set new lows.
On the plus side, these charts use the December Case-Shiller release (the most recent), which as I’ve often discussed best reflects November 2008 pricing. Home prices in the real world have dropped a bit further — and the ratios gotten a bit better — since then.
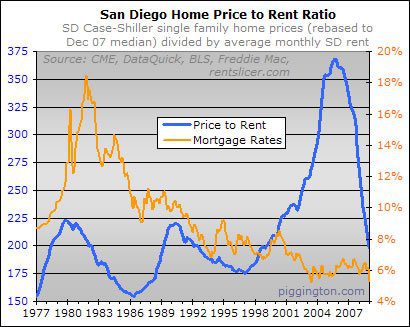
Here are the same charts with conforming 30-year fixed mortgage rates overlaid:
These charts aren’t supposed to serve as timing indicators or to give buy and sell signals. They do not take account of external factors such as unemployment or foreclosures. They don’t account for potential changes to future rents and incomes. And they aggregate the whole county into a single number, ignoring important distinctions between different sub-markets.
What the charts do provide is a broad-stroke view of how expensive San Diego homes are, in aggregate and compared to history, when measured against the region’s average rents and per capita incomes. And these indicators say that while San Diego real estate as a whole is not dirt cheap, it’s perfectly reasonable.
That alone has been a long time coming. Just for some perspective, here is the price to income graph with a blue dot placed over the month that I launched the Econo-Almanac:
Another way to measure valuation is to compare rents and incomes not with home prices but with monthly payments. While this provides some good context, I do not favor this valuation technique. For one thing, mortgage rates are artificially low, with the Fed monetizing into a mortgage market that was already underpricing long-term inflation risk to begin with. But that is just a subset of the general problem with this approach: rates change, and if you are trying to determine long-term sustainable levels of affordability, you have to consider the path of rates over said long-term, not just during a given month.
On top of that, the data suggests that monthly payments haven’t historically made for a good valuation metric. I wrote about this in the last update of these charts:
It is pretty clear that for most of the history displayed on the charts, the payment-to-income and payment-to-rent ratios hewed pretty closely to mortgage rates themselves. Typically, the monthly payment ratios would move up when rates were moving up and down when rates were moving down. It wasn’t until the recent housing bubble, when the payment ratios shot up while rates dropped and then languished at generational lows, that this relationship broke down.
But the recent bubble is an aberration in which home prices rose not due to low rates but to an extended period of incredibly reckless mortgage lending. Looking back beyond this risky-lending-induced bubble, there just isn’t much historical data to suggest that homes should necessarily be more expensive when mortgage rates are low and less expensive when rates are high.
The point can be further illustrated by comparing the recent bubble peak to the early 1980s, when double-digit mortgage rates prevailed. If monthly payments are a good valuation metric, then these charts suggest that the overvaluation of the recent bubble was not nearly as large as that seen in the early 1980s. This is ridiculous, of course. The recently burst bubble absolutely blew away prior booms in terms of magnitude, as a quick glance at the bubble aftermath depicted in this long-term foreclosure graph easily demonstrates.
All that said, monthly payment levels do have an impact. They feed into the rent-vs-buy decision, for instance, which in turn influences demand for housing. So they are worth looking at — they just shouldn’t be looked at in isolation.
And with that long pre-amble, here are the new all-time lows for the monthly payment-based metrics:
Here are the same charts with interest rates overlaid:
The payment-to-income ratio is 3% below and the payment-to-rent ratio 6% below their respective all-time lows, both hit in the 1990s downturn. So by this metric (for what it’s worth, which per the above is questionable) San Diego homes are cheaper than they’ve been since this data began.
But even by the superior price-based indicators shown earlier in this article, San Diego home prices are now reasonable. So despite everything else, the San Diego housing market has that going for it. Finally.
You know we will have to
You know we will have to label you as a heretic now… you know that don’t you?
Here is another classic
Here is another classic example of this economy.
<http://www.youtube.com/watch?v=UgoS61dKY68> http://www.youtube.com/watch?v=UgoS61dKY68
BEDEVERE: Tell me. What do
BEDEVERE: Tell me. What do you do with witches?
VILLAGER #2: Burn!
VILLAGER #1: Burn!
CROWD: Burn! Burn them up! Burn!…
BEDEVERE: And what do you burn apart from witches?
VILLAGER #1: More witches!
————–
Heresy aside, my wife and I have actually found a couple of houses in decent areas that we can afford to buy at 30% DTI with our smack-on-the-median household income. More to the point, we couldn’t afford to rent they very same houses.
So … now what should good little piggies talk about?
I still can’t buy the place
I still can’t buy the place I’m renting for it to make sense unless I put a really good chunk down, which in these times, I’m hesitant to do.
I’ve posted this in other threads, but this is really a perfect place for it and appropriate.
My rent is 1800 a month. There’s a townhouse in my complex selling for 380k. If I were to go the FHA route and put 3% down and pay whatever upfront, closing costs, realtor fees, I’m looking at about 35k or so, more or less.
380k -3% using 5% interest rate. I know, it fluctuates. If I don’t pay points, let’s just go w/5% for now. I’m looking at 1979. But then there’s property tax of 316 and HOAs of 255 and insurance – not sure. Let’s say 50 bucks a month and PMI – 150-180? or so.
I came up w/a grand total of close to 2800 or so. That’s not counting upgrading the unit or any special assessments, since the complex is about 20 years old and surely going to need some maintenance.
So shelling out the minimum, I’m looking at about 1k more for the privilege of “ownership.” And even if I do deduct the interest on my taxes, factoring that in, it’ll be about 300 to 400 less from that. I’m still paying about 600 to 700 more a month.
Also, KIM, there are 4 units w/NODs in my complex. One of the units is for sure an investment property b/c the notice went to their house in PB. So the complex has some potential future inventory putting downward pressure on pricing.
I wouldn’t say that in my complex that rents = owning.
Maybe if I want to tie up more money it could pencil out. But the uncertainty of employment everywhere makes me reluctant. I’d much rather have cash on hand JIC. That and the probability that there could be further declines on the way in my complex, why put more money down the drain, so to speak.
jpinpb wrote:I still can’t
[quote=jpinpb]I still can’t buy the place I’m renting for it to make sense unless I put a really good chunk down, which in these times, I’m hesitant to do.
I’ve posted this in other threads, but this is really a perfect place for it and appropriate.
My rent is 1800 a month. There’s a townhouse in my complex selling for 380k. If I were to go the FHA route and put 3% down and pay whatever upfront, closing costs, realtor fees, I’m looking at about 35k or so, more or less.
380k -3% using 5% interest rate. I know, it fluctuates. If I don’t pay points, let’s just go w/5% for now. I’m looking at 1979. But then there’s property tax of 316 and HOAs of 255 and insurance – not sure. Let’s say 50 bucks a month and PMI – 150-180? or so.
I came up w/a grand total of close to 2800 or so. That’s not counting upgrading the unit or any special assessments, since the complex is about 20 years old and surely going to need some maintenance.
So shelling out the minimum, I’m looking at about 1k more for the privilege of “ownership.” And even if I do deduct the interest on my taxes, factoring that in, it’ll be about 300 to 400 less from that. I’m still paying about 600 to 700 more a month.
Also, KIM, there are 4 units w/NODs in my complex. One of the units is for sure an investment property b/c the notice went to their house in PB. So the complex has some potential future inventory putting downward pressure on pricing.
I wouldn’t say that in my complex that rents = owning.
Maybe if I want to tie up more money it could pencil out. But the uncertainty of employment everywhere makes me reluctant. I’d much rather have cash on hand JIC. That and the probability that there could be further declines on the way in my complex, why put more money down the drain, so to speak.[/quote]
As Rich said, this is an overall look at San Diego. It doesn’t take into account variations between submarkets.
You’re looking at, or close to the coast – those areas, and high end areas further in like 4S, haven’t seen nearly the depreciation of areas like most of North County (excluding coastal areas from Carlsbad on down), East County, and the southern cities.
It makes sense to wait if that’s your desired area – I can pretty well guarantee those price drops are coming to your area. Theres only so much extra people will pay to be 5 miles closer to the beach – which is why the areas with price drops are selling lots of houses, while inventory in higher priced areas (like the coastal areas) is sitting frozen by and large.
SDEngineer wrote:
Theres only
[quote=SDEngineer]
Theres only so much extra people will pay to be 5 miles closer to the beach – which is why the areas with price drops are selling lots of houses, while inventory in higher priced areas (like the coastal areas) is sitting frozen by and large.[/quote]
This says it all. There will be such disparity, and buyers are going to question whether buying in a traditionally better area is worth it, when so many better deals can be had elsewhere. I expect that realization will slowly filter into middle class “I’m alright Jack”, but when it does, the absurdity of California house prices will come sharply into focus. Then we’ll all be ensconced in (California) normalcy.
Great, after I spent my
Great, after I spent my savings getting my teeth fixed! This was supposed to take at least another 2-3 years to correct!
DANG IT!
Rich,
Thanks for making this
Rich,
Thanks for making this specific point:
“And they aggregate the whole county into a single number, ignoring important distinctions between different sub-markets”.
It has become obvious that the coastal areas are lagging in price correction, with over correction occurring in several inland markets. It will be interesting to now watch the equilibrium that will occur in these two extremes.
North15 wrote:Rich,
Thanks
[quote=North15]Rich,
Thanks for making this specific point:
“And they aggregate the whole county into a single number, ignoring important distinctions between different sub-markets”.
It has become obvious that the coastal areas are lagging in price correction, with over correction occurring in several inland markets. It will be interesting to now watch the equilibrium that will occur in these two extremes.[/quote]
That’s what I was thinking. We need to see more movement everywhere to get a true correction.
Now if we could just count on
Now if we could just count on rents and incomes to not start adjusting downward….
I don’t understand how they
I don’t understand how they collect the median number. It is from sfr sale prices? Or sfr and condos lumped together? If more of the cheap stuff is selling, then the median would be brought way down, no?
So if the houses in the middle range haven’t budged much since the peak (as compared to the crap shacks), then the majority of houses are not at historic lows (ratio-wise), are they? Just the low priced ones that are selling.
We would need to see more movement in all price ranges to get a true correction. Am I wrong?
Maybe I should have woken up for my statistics classs in college.
ralphfurley wrote:I don’t
[quote=ralphfurley]I don’t understand how they collect the median number. It is from sfr sale prices? Or sfr and condos lumped together? If more of the cheap stuff is selling, then the median would be brought way down, no?
So if the houses in the middle range haven’t budged much since the peak (as compared to the crap shacks), then the majority of houses are not at historic lows (ratio-wise), are they? Just the low priced ones that are selling.
We would need to see more movement in all price ranges to get a true correction. Am I wrong?
Maybe I should have woken up for my statistics classs in college.[/quote]
I believe the statistics on this and other sites posted by a number of folks show that both the low and the mid end (under 500Kish) have shown a lot of movement. Only the high end (esp. jumbo’s) is stagnant. Certainly in the last 18 months of watching the market, I’ve seen those discounts moving higher up the food chain. Check out mid-market areas that aren’t at the coast, and you’ll find they’ve undergone some pretty drastic shifts over the past year (areas like Discovery Hills in San Marcos, western and newer areas of Mira Mesa, Santee, etc.). All areas where the crap dropped first, then the nicer middle market areas fairly nearby.
I know Rich mentions this
I know Rich mentions this post doesn’t take in account submarkets, but that is a huge factor. All across the Coast of CA from SF to San Jose to LA to OC to SD…the only houses selling are the bank owneds at the very low end of the market. These are not in the good school districts or desireable locations.
So how can you possibly come up with a rent to price ratio when the medians are incredibly skewed right now in CA to the low end? I mean come on, the Bay Area median is now $300k. Because the only thing selling are the bank owneds in crap hole neighborhoods like Antioch and Vallejo. If you looked at the price to rent ratio for San Fran, Palo Alto, Etc… it would still suck. The same goes for Rancho P., Carmel Valley, Encinitas, Beach communites, etc, etc, etcc… the rent to price ratio still sucks.
Yeah I do agree it’s good now in City Heights, Oceanside, Chula Vista, Escondido and East County. But that is very skewed and does not represent SD County.
ctr70 wrote:I know Rich
[quote=ctr70]I know Rich mentions this post doesn’t take in account submarkets, but that is a huge factor. All across the Coast of CA from SF to San Jose to LA to OC to SD…the only houses selling are the bank owneds at the very low end of the market. These are not in the good school districts or desireable locations.
So how can you possibly come up with a rent to price ratio when the medians are incredibly skewed right now in CA to the low end?
[/quote]
Rich isn’t using the vanilla median (which is even lower). He’s using the Case-Shiller numbers, which are representative as they measure same house comparable sales.
Not that some submarkets are still significantly overpriced (like the coastal and high end zones), but the majority of the market (not just the low end) is now pretty reasonable.
Congrats to San Diego
Congrats to San Diego Piggs!
Those of us eyeing property in other still-inflated areas will have to remain patient, as will those San Diegans who want to live near the coast. I’ll hold onto my champagne for now.
Now if I just had a job! Just
Now if I just had a job! Just kidding,actually I bought (I’m now renting money) in February. I haven’t gotten buyers remorse,probably because I got a really nice repo at 46% of the high. I suspect there will be a small rush to buy this spring to collect the $8000 tax credit.
Here’s the real question.
Here’s the real question. What has the affordability ratio been historically in the beach areas… I would bet to say it has never been as good a ratio as elsewhere and rightly so. Coastal areas cost more.
Any info on this Rich?
Good points all around. There
Good points all around. There is no doubt that many areas in the county still have a alot of depreciation left in them. How long it will take for them to go is debateable but I think we have a few years to go. However there is also not a doubt in my mind that these places will always always always run much higher then the national dti numbers.
Gotta grab a hankie here,
Gotta grab a hankie here, Rich. It’s like the end of an era. You just said “that which cannot be said” on a bubble blog. 😉
We could see this trend coming just by the actions taken by fellow bubble-sitters over the past few months. It seems many have purchased their own homes after waiting for years to buy a house. They’ve been telling us that they are paying less to own than equivalent rent, and even the staunchest of the bears have to agree that this is one of the most important metrics when valuing home prices.
Kinda sucks, because it was fun being a housing bear when everyone else was delusional.
I admit that many areas are pretty clear for buying right now, and the downside is greatly minimized for today’s buyers. Our old home which we sold for ~$400K in 2004 had a model-match sell the other month in the high $100K range (~$190K, IIRC), and if you consider those homes actually peaked at around $475K-$500K in 2005, that’s a pretty steep haircut. We purchased it in early 1998 for just under $120K, so it doesn’t look so crazy anymore.
We’re still waiting for the higher-end areas to fall, but I sincerely wish all the recent purchasers the very best in their new homes.
At this point, even we have to weigh the amount of decline and length of time it will take to see the remaining decline in our area. We may end up paying more in rent than what we’d save by waiting. We’ve been actively looking, and if we find the exact right house at a price around 2001-2002 levels, we will probably buy, too.
Thank you so much, Rich, for keeping up this blog so we could trade ideas and thoughts with one another. It’s been a life saver for so many people!
Cheers! 🙂
I’m so tempted to say: we
I’m so tempted to say: we told you so! We, the temecula buyers, have been arguing that price has returned to normal in our hoods for months. There is still downside as price may overshoot (It is a battle against the government bailout effort. I don’t know which side might win). So if your goal is to maximize the investment return (such as buying a rental property), I would think it is still smart to wait. But if your goal is just a home, the current price looks alright at non-coastal area if you can find the right house. For Inland Empire as an example, the average monthly rent for an apartment is $1,157 and the average after-tax monthly mortgage payment on a median-priced single-family detached home is $971, so it is not a bad time to own a house.
On the topic of rental property, I still haven’t figured out why the “investors” are rushing to buy houses. Yes, cashflow is positive if the rent could stop dropping. But at the same time, we have no hope of significant price appreciation due to the hidden inventory (therefore equity is dead money) and the cashflow is really tiny. If a major maintenance comes up or you encounter a tenant who doesn’t pay his rent, here goes your cashflow.
Also, I always believe that most recent-purchased properties can cashflow because their owners are playing with the black-swan event. Many of those I know do not insure enough or delay maintenance, that’s why they could cashflow. Did anyone read the story that sometime ago a landlord lost a lawsuit because he failed to replace his window screen therefore the unfortunate tenant was raped? That’s right, the window screens are supposed to keep out flies, mosquitoes, moths and rapists. What’s the rush to be a landlord when you could potentially face hugh liability whenever someone gets hurt within your property?
then you put the screen on,
then you put the screen on, and there is a fire and they get burned, and they say the screen kept them in!
Because Chrome crashed and
Because Chrome crashed and lost my open tabs, I can’t find the link I’m looking for.
One of the other sites I frequent (or it was here and I just can’t find it), indicated median housing sell prices are moving up. Yaay, we are saved, right? Unfortunately, they’re moving up because the foreclosures are moving upmarket. Houses are not selling for more.
With many ARMs yet to fail, the Fed diluting our Dollar (they added $1 Trillion dollars lately, reducing the value of the Dollar for good or bad), and businesses continuing to fail, do we really think the bottom is coming in?
I don’t, but I’m not smart about this stuff anyways (e.g. please feel free to contradict me constructively), I’m taking my own haircut right now.
I went to a finance seminar
I went to a finance seminar yesterday, and a stanford professor was speaking. He went into how the fed needed to put that money into the economy, and that the difference is that the money is put into the economy but the velocity of the money cycling through is slow, so that is why we haven’t experienced any inflation.
He also said that the fed thinks that they will be able to see when there is too much money and cut off the tap before inflation gets out of hand. He said that many are skeptical.
With the job market the way it is, I’m really having doubts if this is a good time to buy. I think that housing in close to coastal areas still can go down, and that a few more unemployment announcements may change the buy mentality. It’s easy to lose focus on how bad the economy is when the stock market has had a week or so of gains. The real problem is that layoffs are not over.
Consider the multiplier
Consider the multiplier effect of when a lender lends out money. 30:1 money creation takes place. That’s inflationary and real velocity as it’s money creation as well as velocity. Now consider when the Fed lets lenders pile-up money in their balance sheets? If it does not get lent out, there’s no velocity and no 30:1 money creation. Herein lies the problem with assuming money in the banking system will lead to increases in prices. There’s a high historical correlation of this, but correlation is not causation.
The money needs to get lent out to have the inflationary effect of raising prices. And what are the factors that cause money to get lent out??? This is a credit implosion we’re experiencing right now. Not a standard recession.
And, what does it take to buy a house? Usually, the biggest utilization of credit in most people’s lives. Unemployment usually has an effect on this.
I don’t believe the current
I don’t believe the current estimated per capita income data is accurately capturing the changes to the economy of the past 6 months or so.
But what would this really mean? Only that the steep dive in the first chart (price to income ratio) may currently be plunging a little less rapidly than shown. Which could also mean that we’re a little closer to the actual bottom.
Great info Rich. There is a lot to digest there.
So in San Diego, historically
So in San Diego, historically the price to income ratio is 7-9? Nationally it’s 3-4? Wow, what a discrepancy there.
danthedart wrote:So in San
[quote=danthedart]So in San Diego, historically the price to income ratio is 7-9? Nationally it’s 3-4? Wow, what a discrepancy there.[/quote]
As noted in a previous post, Rich is using per capita income in his post. The 3-4x national ratio is using median household income. There’s a large difference between household and per capita income.
In San Diego, per capita income (2006 numbers) was about 39K. Household income for the same period was about 66K.
Using those numbers, San Diego’s historical price to income ratio is normally in the 4x-5x median household income. More expensive than national, yes, but not quite as bad as you thought.
How does Case-shiller index
How does Case-shiller index account for the weighting factor of different areas? I know they use sales-pairs of the same houses. But still if there are 10 houses sales-pairs in oceanside with a price reduction of 50%, and 1 house sales-pairs in CV with a price reduction of 5%, I guess CSI will give a different value than the opposite case (where 10 sales-pairs in CV and 1 sales-pair in Oceanside).
Because most sales-pairs are from lower-end areas, even CSI gives a biased value, though better than plain median value.
If i’m correct, all the analysis in the post needs to be taken with a bowl of salt!
A better analysis would be to do same analysis on zip-code basis (or a group of them). esmith already has software to recreate CSI on a zip-code basis. If we can find income and rent info for each zip-code (or a group of them), then similiar graphes can be made which will give a much better picture of current housing market.
paranoid wrote:
A better
[quote=paranoid]
A better analysis would be to do same analysis on zip-code basis (or a group of them). esmith already has software to recreate CSI on a zip-code basis. If we can find income and rent info for each zip-code (or a group of them), then similiar graphes can be made which will give a much better picture of current housing market.
[/quote]
So, where can we view these charts/data that esmith produces?
Huckleberry wrote:paranoid
[quote=Huckleberry][quote=paranoid]
A better analysis would be to do same analysis on zip-code basis (or a group of them). esmith already has software to recreate CSI on a zip-code basis. If we can find income and rent info for each zip-code (or a group of them), then similiar graphes can be made which will give a much better picture of current housing market.
[/quote]
So, where can we view these charts/data that esmith produces?[/quote]
http://sdhpi.blogspot.com/
Wow, Rich, I’m kind of
Wow, Rich, I’m kind of scratching my head at this graph.
Contrary to my earlier prediction, the price to income ratio has just kept rocketing almost straight down for the past year. I see no sign of inflection (shallowing-out) in this graph yet. Will it pull up in 2010 and match the 1996 bottom or just keep heading to the earth’s core? I dunno.
I can’t bring myself to call us “near the bottom” yet because the fundamentals just don’t seem to be there. In your immediately previous post you noted that the job market in San Diego is imploding… and Dr. Housing Bubble doesn’t think that the California economy will turn around until 2011. Then there are all those Alt-As which have only begun to reset in earnest this year, and will be continuing to hit all this year and into next.
No, I’m not saying you said “we are near bottom”, I understand you simply pointed out we have gotten into the “band of normalcy”. I’m just wondering, based on the fundamentals and on peoples’ mood, if the price/income ratio will even stay in the “band of normalcy” and bottom out somewhere in there, or will it challenge the previous lows, or will it blast on through and form a new bottom.
I guess time will tell. Meanwhile I continue saving my pennies for that down payment.
I hope we’ll undershoot just
I hope we’ll undershoot just as we overshoot.
Both the rise and fall rate
Both the rise and fall rate of the Price to Income graph are unprecedented. The two previous peaks had 6-8 year market declines. If trends continue, we’re looking at peak-to-trough in less than 5 years total.
When this recession ends and job growth resumes, the housing market should bottom out. I’m personally planning to buy in 12-18 months (as much for personal finance reasons as market timing). Like the stock market, there’s no point in trying to catch a falling knife: better to wait until we’re a couple months into the rebound.
AN–
I think my favorite
AN–
I think my favorite “undershoot” graph is the one that esmith made a week or so ago.
Hi Piggs — In writing up the
Hi Piggs — In writing up the payment ratios for voiceofsandiego.org, I thought of a couple things I didn’t mention in this article. I will excerpt them below.
First, not only are prices lower than they were as of Dec 08, but rates are lower too:
Second, a bit more color on the meaningfulness of the payment ratios vis-à-vis the price ratios:
Whole article is here if you’re interested.
Rich
Maybe close to a bottom, but
Maybe close to a bottom, but I think the top goes right along with it. Not that many qualified buyers anymore! “Wanting” a house does not equal demand like it used to.
“So … now what should good
“So … now what should good little piggies talk about?”
the rent bubble.
about the chart… it’s scary. really scary. that’s the population boom/bust chart in which what follows is either extinction or flat, near zero population. in terms of housing, that would be either social collapse and barter town or prices going to zero and staying there.
the chart has only barely slowed its rate of decline and yet it’s already hit the lows of the prior 40 years. sd home prices may now be affordable, but it’s heading straight to irrelevance.
Somebody call 911!
Space
Somebody call 911!
Space alliens have landed and taken over Rich’s body!!!!
😉
LOL, I think Rich has been
LOL, I think Rich has been kidnapped by NAR and they hijacked his website!
Or, he’s being blackmailed by them…
It’s true. Lereah and I are
It’s true. Lereah and I are BFF now… I keep him company while he eats egg mcmuffins in his car. I’m also honored to have been hired as the person who gets to apply tanning cream to that hard-to-reach spot on Tangelo Mozillo’s upper back.
Now if you’ll excuse me, I’m off for a grillout on George Chamberlin’s patio.
Seriously, lest people misinterpret the message of the article, I direct your attention to this line:
Rich
PS If you don’t know what that egg mcmuffin reference is about you absolutely must drop everything and read this hilarious article: http://online.wsj.com/article/SB123152099299568447.html
LOL! 🙂
LOL! 🙂
Rich, that WSJ article about
Rich, that WSJ article about David Lereah is hilarious, as you say. There are too many reasons these days for righteous indignation, but David’s personal situation is a wonderful example of a couple of key things wrong with the bubble:
1. An individual who influenced many others to do irresponsible things, to the others’ possible detriment and that of society at large. An individual who refuses to accept the enormity of what they did to inflate the bubble, and to accept responsibility. A society that doesn’t hold them fully accountable.
2. Personal financial gains, even amidst the economic crisis, for those who participated in the bubble. Most people who bought more house than they need / can afford are still holding on to net gains, because they bought early enough, and the market has not been allowed to drop to its natural level. And most government actions are taken to help those people hold onto these unearned gains that distort our economy and make it less efficient for people who produce real goods and services.
Rich Toscano wrote:
PS If you
[quote=Rich Toscano]
PS If you don’t know what that egg mcmuffin reference is about you absolutely must drop everything and read this hilarious article: http://online.wsj.com/article/SB123152099299568447.html
[/quote]
That guy should be working at McDonald’s after his part and contribution to the damage that’s been done.
Also, we need to keep in mind that we didn’t just have low rates – we had low adjustable rates. If you were able to get a 2% rate for 30 years, I would think things might be a little different perhaps.
People took advantage of low rates to get their foot in the door, but knew it was temporary and hence commenced the flipping ASAP w/in 2 years and the hot-potato game started.
Though we can say interest rates in the past did not have a direct correlation to home prices, this particular breed and strain and combination of ARMs and NINA and zero down is an anamoly that did not exist historically. If we factor all that in together w/e-z lending, you have the perfect storm.
In the article, Rich
In the article, Rich wrote:
But the recent bubble is an aberration in which home prices rose not due to low rates but to an extended period of incredibly reckless mortgage lending. Looking back beyond this risky-lending-induced bubble, there just isn’t much historical data to suggest that homes should necessarily be more expensive when mortgage rates are low and less expensive when rates are high.
—————–
This is true, but tends to ignore other factors that came into play during those years, like:
-Baby Boomers being net buyers (instead of net sellers as they will be going forward)
-Many decades of wages increasing over time, spurring the notion that one should always stretch their finances to the max when buying a house because they could pay it off “with cheaper money” going forward. Maybe that can happen now, but I’m seeing very little evidence of rising wages going forward.
-People had more secure jobs and still believed in the “one employer for life” model. This, along with an assumption of rising wages over time, made it seem logical to “buy as much house as possible.” They also would be more willing to buy (and less concerned about timing market bottoms) because they figured they could better weather the ups and downs of the housing cycles if their jobs were fairly stable, or if they thought they could easily replace their jobs for similar wages.
And finally, if interest rates didn’t affect housing prices, why is everybody in the financial/political world doing everything possible to keep rates down right now — especially when one considers the risks they are taking with our currency? If interest rates don’t affect housing prices, let them raise rates to the sky!!! Man, would I love to see that!
You are right as usual,
You are right as usual, CAR… there were of course many factors feeding into this whole thing. But I do think that the securitization/e-z lending thing was the prime mover.
Just to clarify, also, I didn’t say that rates don’t affect housing prices, what I was trying to say was that since rates change, payments are not as good a valuation metric as sales prices when it comes to determining whether houses are over or underpriced for the long term.
rich
We definitely agree on that,
We definitely agree on that, Rich.
As for the securitization and EZ lending, I think that trend was really magnified by the low rates.
We know foreigners hold a lot of this paper, but what’s not said often enough (at least before the AIG scandal) is that pension funds, insurance companies and mutual funds were/are very heavily invested in this paper. They have a certain return that they **need** to get in order to stay solvent over the long-run. By keeping rates artificially low for so long, the Fed essentially forced all of these traditional, fixed-income investors into riskier and riskier investments. They essentially didn’t have a choice, especially when you consider the losses they took after the dot com implosion.
I hold the Fed accountable primarily because they created an environment where normally conservative, fixed-income investors were forced to buy all these Frankensteinish securities. All the while, banks and other financial institutions were making tremendous returns acting as the middle-man on these investments. They literally have destroyed this country, IMHO.
So I guess there really is a
So I guess there really is a “sunshine tax”, since San Diego doesn’t follow the national average of 3-3.5 times household income, as history has shown it closer to 4-5 times. Does that tax increase on April 1st as well?
poorsaver wrote:So I guess
[quote=poorsaver]So I guess there really is a “sunshine tax”, since San Diego doesn’t follow the national average of 3-3.5 times household income, as history has shown it closer to 4-5 times. Does that tax increase on April 1st as well?[/quote]
The “sunshine tax” is here regardless of the cycle.
I moved to San Diego from the midwest in the mid 1990’s. When we bought our ~1000 sf Clairemont 1960’s stucco box for 160K in 1996 (within months of the bottom) the equivalent property in the inner ring of suburbia in the midwest would have been 60-70K.
‘Submitted by paranoid on
‘Submitted by paranoid on March 25, 2009 – 12:45pm.
How does Case-shiller index account for the weighting factor of different areas? I know they use sales-pairs of the same houses. But still if there are 10 houses sales-pairs in oceanside with a price reduction of 50%, and 1 house sales-pairs in CV with a price reduction of 5%, I guess CSI will give a different value than the opposite case (where 10 sales-pairs in CV and 1 sales-pair in Oceanside).’
Rich, Do you know the answer to this questions?
I believe that the conclusion
I believe that the conclusion from the graphs presented in this article is misleading, because CSI is distorted by the mix of sales, just as plain median value does, just in a different way.
CSI says that San Diego as a whole has lost more than 40% in housing price from the peak. I don’t think this is correct. if you looked at the tiered values, you will see that the aggregate value (SD as a whole) is tracking mainly the low and mid tiers(<$400k)(see sdhpi.blogspot.com) where most sales are taking place due to REOs. This is because the aggregate is mainly accounting for Sales, not the volume of houses not for sales. I.e. areas (CV/La Jolla etc) where sale volume is very low are under represented in the CSI, while areas (like oceanside, chula vista etc.) where sales volume is very high due to REO are over represented in the CSI. The graphs Price/Rent, Price/Income are misleading in the sense that the sale mix today is very different from the mid-90s, due to today's very high REO proportion. So yes the housing pricing is getting better, but much less than the graphs would imply. There are many engineers on this board, I'm surprised that little doubt has been raised about these graphs.
paranoid wrote:
The graphs
[quote=paranoid]
The graphs Price/Rent, Price/Income are misleading in the sense that the sale mix today is very different from the mid-90s, due to today’s very high REO proportion.
[/quote]
Can you point us to a source that indicates what proportion of sales in the early-mid 1990’s was due to REOs. My recollection of the 93-95 time frame was that they were a significant portion of sales.
FormerSD: you can find such
FormerSD: you can find such data by looking at Rich’s past posts on NOD/NOT, in particular the Sales / NOD (or NOT) graphs.
Here is the relevant bit from
Here is the relevant bit from the Case Shiller methodology doc:
So, they underweight homes with larger price changes and overweight high-priced homes. Both these adjustments would work to offset the phenomenon that paranoid described.
That said it’s a valid point to keep in mind. This is why I have tried to emphasize that these ratios are just one piece of the puzzle that provide a broad-stroke view of things — and also that they don’t account for big regional differences.
However, I think they do provide substantial analytical value and I think it’s a big overstatement to say that they are misleading or should be ignored. That btw is exactly what the bulls said when the p/i ratio was at 14.
Rich
jpinpb, I just read this
jpinpb, I just read this thread and your post was a while back. But I think that if you can only put 3% down, you should not be buying, and that is why your calculations of rent vs buy dont add up to buy. Based on your financials, you should continue to rent. When you can go 20% down, buy.
I can put more than 3% down,
I can put more than 3% down, but w/the way the economy is, I’d rather not tie up the cash. I’d rather have more funds available in case of emergency. That, and I think that if property values continue to decline, you are losing a lot of what you put down and who knows when you’ll get it back. To me it makes no sense to put more down.
I put 20% down when I bought in Carmel Valley during the early ’90’s and spent most of the ’90’s wishing I had the cash. And of course the house depreciated more than 20% back then. In fact, I think I ended up not able to refinance b/c of the loss of value and having to pay PMI. Luckily I was able to ride it out.
But lesson learned. Why tie up the money if you don’t have to. As long as I have it available, I feel comfortable buying w/less down. I don’t intend to go in over my head and since the market is unstable, I want the numbers to add up.
Me thinks Rich may be eyeing
Me thinks Rich may be eyeing a purchase at this very moment….softening the blow for his eventual announcement…..’member when OCRenter did this on his Blog……”the horror……..the horror”
LOL. “……”the
LOL. “……”the horror……..the horror”
hehe.
I was thinking the same thing. He’s prepping us.
Rich – you gonna jump off the fence? We can do an intervention and talk you up 🙂
jpinpb wrote:LOL.
[quote=jpinpb]LOL. “……”the horror……..the horror”
hehe.
I was thinking the same thing. He’s prepping us.
Rich – you gonna jump off the fence? We can do an intervention and talk you up :)[/quote]
Nope… just reporting the data.
Rich
I agree 100%. I keep check
I agree 100%. I keep check of RB, RP, LJ, DM, SB, Poway, the price of a decent house in these locations are NOT dropping to a reasonable price yet. I guarantee you that. Most sellers are still holding on for their goldmines and hoping for $700k, $800k for their mac mansion house with a 5000 sq fts lots.