It’s time for the belated monthly sales data roundup. Let’s dive right in…
Median prices were down year over year for all involved:
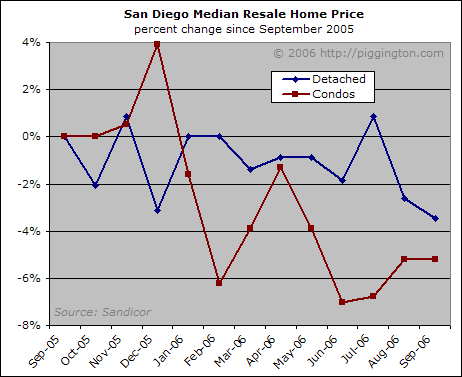
The resale numbers indicated above look absolutely rosy compared to those for new homes and condos, which according to a recent Union-Tribune article have experienced a 17% decline in median price over the past year. The industry talking heads claim that the decline is due to a preponderance of low-cost condo conversion sales, but I find this explanation suspicious. Condo conversions were all the rage last year, whereas this year demand is so poor that some developers have started to re-convert their units back into apartments. How can it be that conversion sales volume has increased enough since last September to pull the median down a whopping 17%, or anywhere close?
I think a more likely explanation is that developers, unlike private homeowners, cannot afford to wait around and are pricing their inventory to move. Unfortunately I do not have access to the new home sales data so can’t I verify this suspicion one way or the other.
Back to resale homes, the median price per square foot, which provides a better indication of what buyers are getting for their money (more background here), was down even more than the overall median:
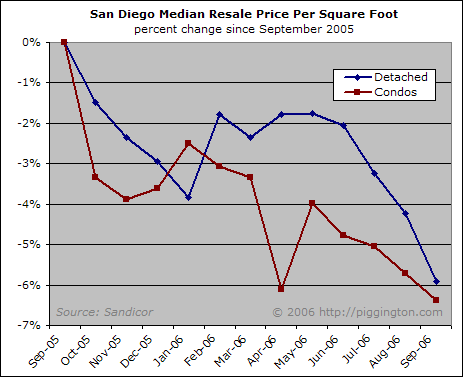
The $/sqft metric, while better than the median price, is still subject to such distortions as changes in quality (above and beyond that which is measured in square footage) and increasing buyer incentives.
Given the potential overstatement of $/sqft and the fact that the new home category is faring worse than the resale category, I’d say that the 6% figure is probably a minimum estimate for the price decrease experienced by the typical San Diego home since last September. In other words, we have already surpassed the maximum price declines predicted by most industry analysts, and things appear to just be getting started.
I say this not just because San Diego housing remains vastly overpriced (it does), but because other market indicators continue to support the idea that things will get worse before they get better.
Sales continue to run at 25%-35% below the prior year’s numbers:
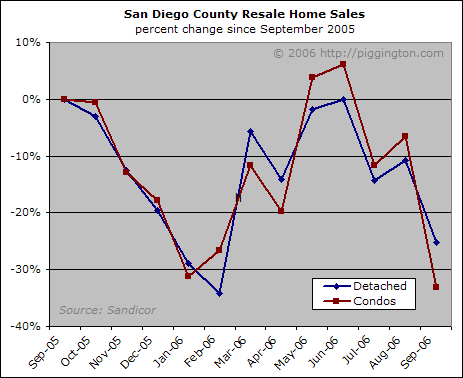
And as I noted in a prior post, inventory, while having pulled back a bit in recent months, is 55% above last year’s value:
A 55% increase in inventory and a ~30% decrease in sales do not indicate to me that we are about to begin the next leg up. I guess that makes me a doom-and-gloomer.
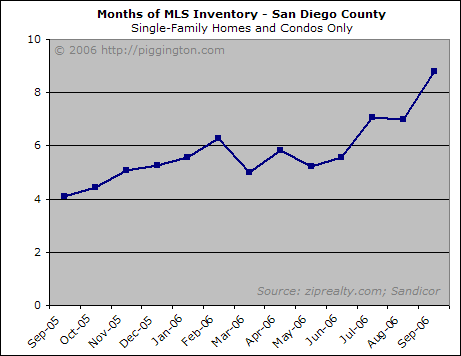
After a few requests here, I finally got some time to collect the data required to plot the months of MLS inventory going back a year. This indicator, which is calculated very simply by dividing a given month’s inventory by that month’s number of sales, provides a single number to measure supply vs. demand. There is some volatility due to seasonal factors, but as always that issue can always be resolved by paying attention to year over year comparisons.
Looking at the graph below it becomes apparent that the supply/demand situation has really fallen apart over recent months, and that the months of for-sale inventory now stands at more than twice last year’s levels:
Meanwhile, various industry shills are trying to claim — against the backdrop of inventory gluts, declining real estate industry employment, resetting mortgages, potential tightening in the lending markets, and generally increasing pessimism — that the bottom is in for housing.
Obviously, that is a ridiculous assertion that can be added to the gallery of ridiculous assertions that these jacklegs have consistently made for several years running. This downturn has years yet to go.
Rich-
Thanks for the data.
Rich-
Thanks for the data. Your Price Per S.F. chart is very helpful – something I NEVER see in the mainstream media, which tends to simply regurgitate the Median Sales Price figures and print quotes from the usual suspects.
Meanwhile, various industry
Meanwhile, various industry shills are trying to claim — against the backdrop of inventory gluts, declining real estate industry employment, resetting mortgages, potential tightening in the lending markets, and generally increasing pessimism — that the bottom is in for housing.
To me it’s all about the resetting mortgages and lending standards. As prices fall the standards will get tighter and tighter, and that alone will easily knock out 50% of the buyers that could have qualified to buy homes at these prices last summer. Add on top of that more inventory from distressed borrowers who were allowed to take out loans like that and I have a hard time seeing how we’re anywhere near the bottom. It’s just getting started, especially up here in LA.
I saw a report on the local
I saw a report on the local news last night that according to a local real estate “expert” (I think it was Alan Nevin?), that this is a great time to buy. Why?
According to Alan, because rents are increasing and homebuilders will be offering great deals in the fourth quarter.
How do you think this works? Does Alan just call up the news and say that he wants to discuss the market and they go ahead and put him right on. Whenever he feels that the sheeple need a little extra motivation he simply picks up the phone and says whatever he wants?
We have similarly-shaped
We have similarly-shaped curves, but numbers are not yet across-the-board negative in Silicon Valley.
Our most-recent, “The Last 30 days,” is at:
http://www.viewfromsiliconvalley.com/id264.html
-and-
“Al RE is local,” for real-world examples, is at:
http://www.viewfromsiliconvalley.com/id265.html
New editions will be coming out in the next few days.
Thanks!
The detached resale price
The detached resale price per sqft data is fascinating… The data shows a Spring Bounce followed by the Cruel Summer. There was a 4% price decline since June! Looking back a year, we can expect to stay on this trajectory until next spring, which would bring us to over 10% down by April.
In my mind, if prices continue to plummet next spring, with no bounce, the decline will begin to accelerate (as if -1.2% per month isn’t already fast enough.)