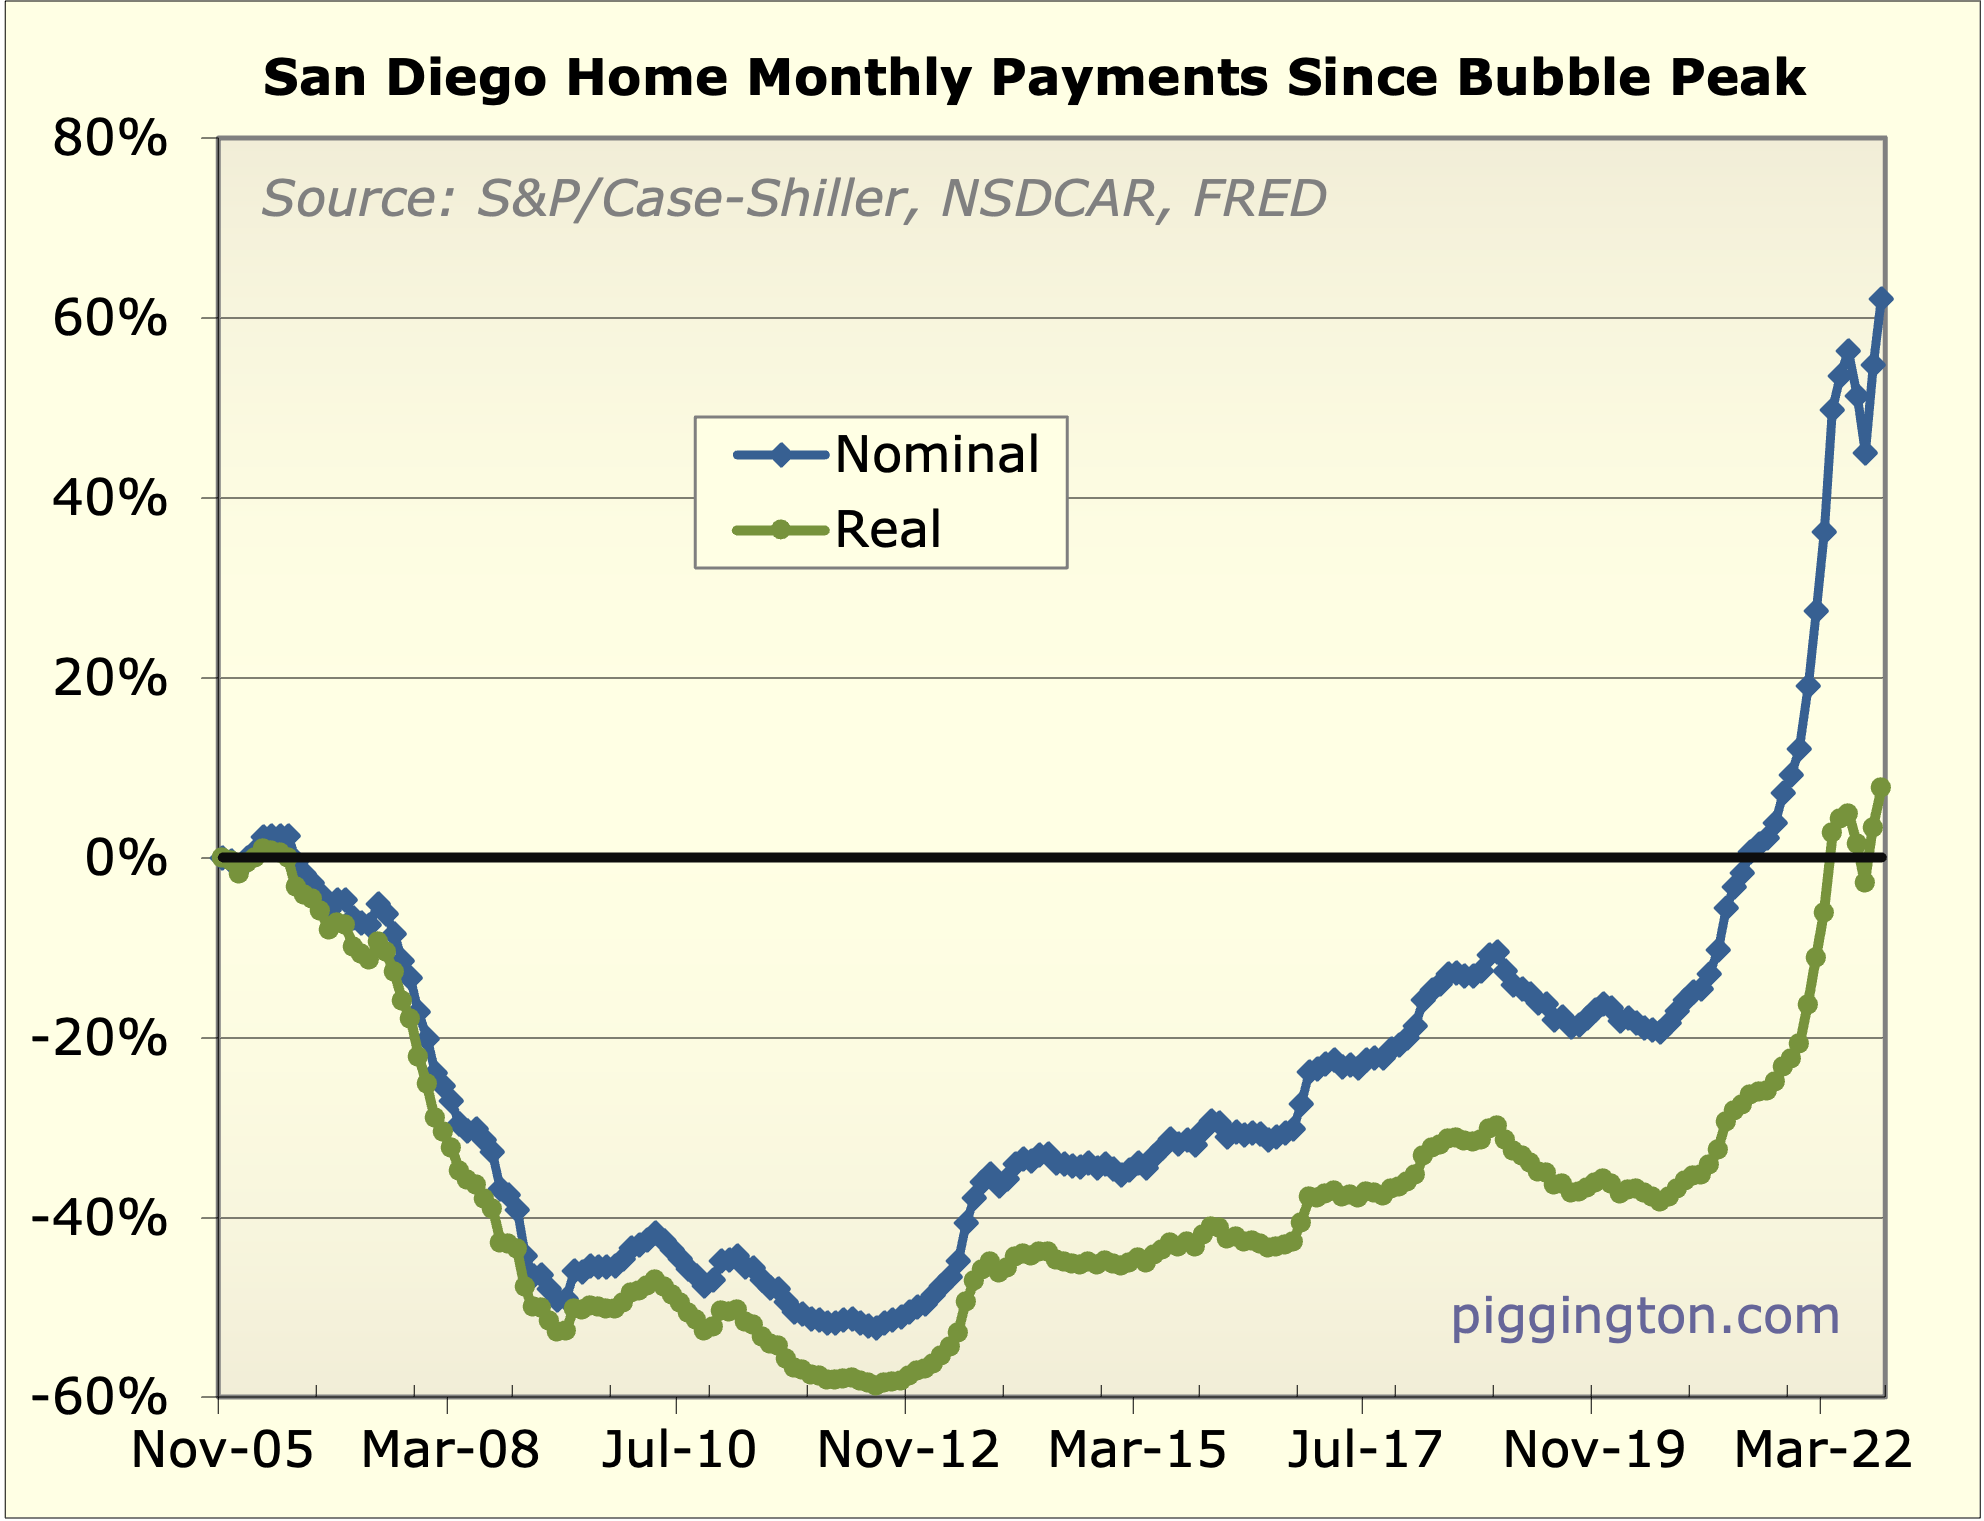
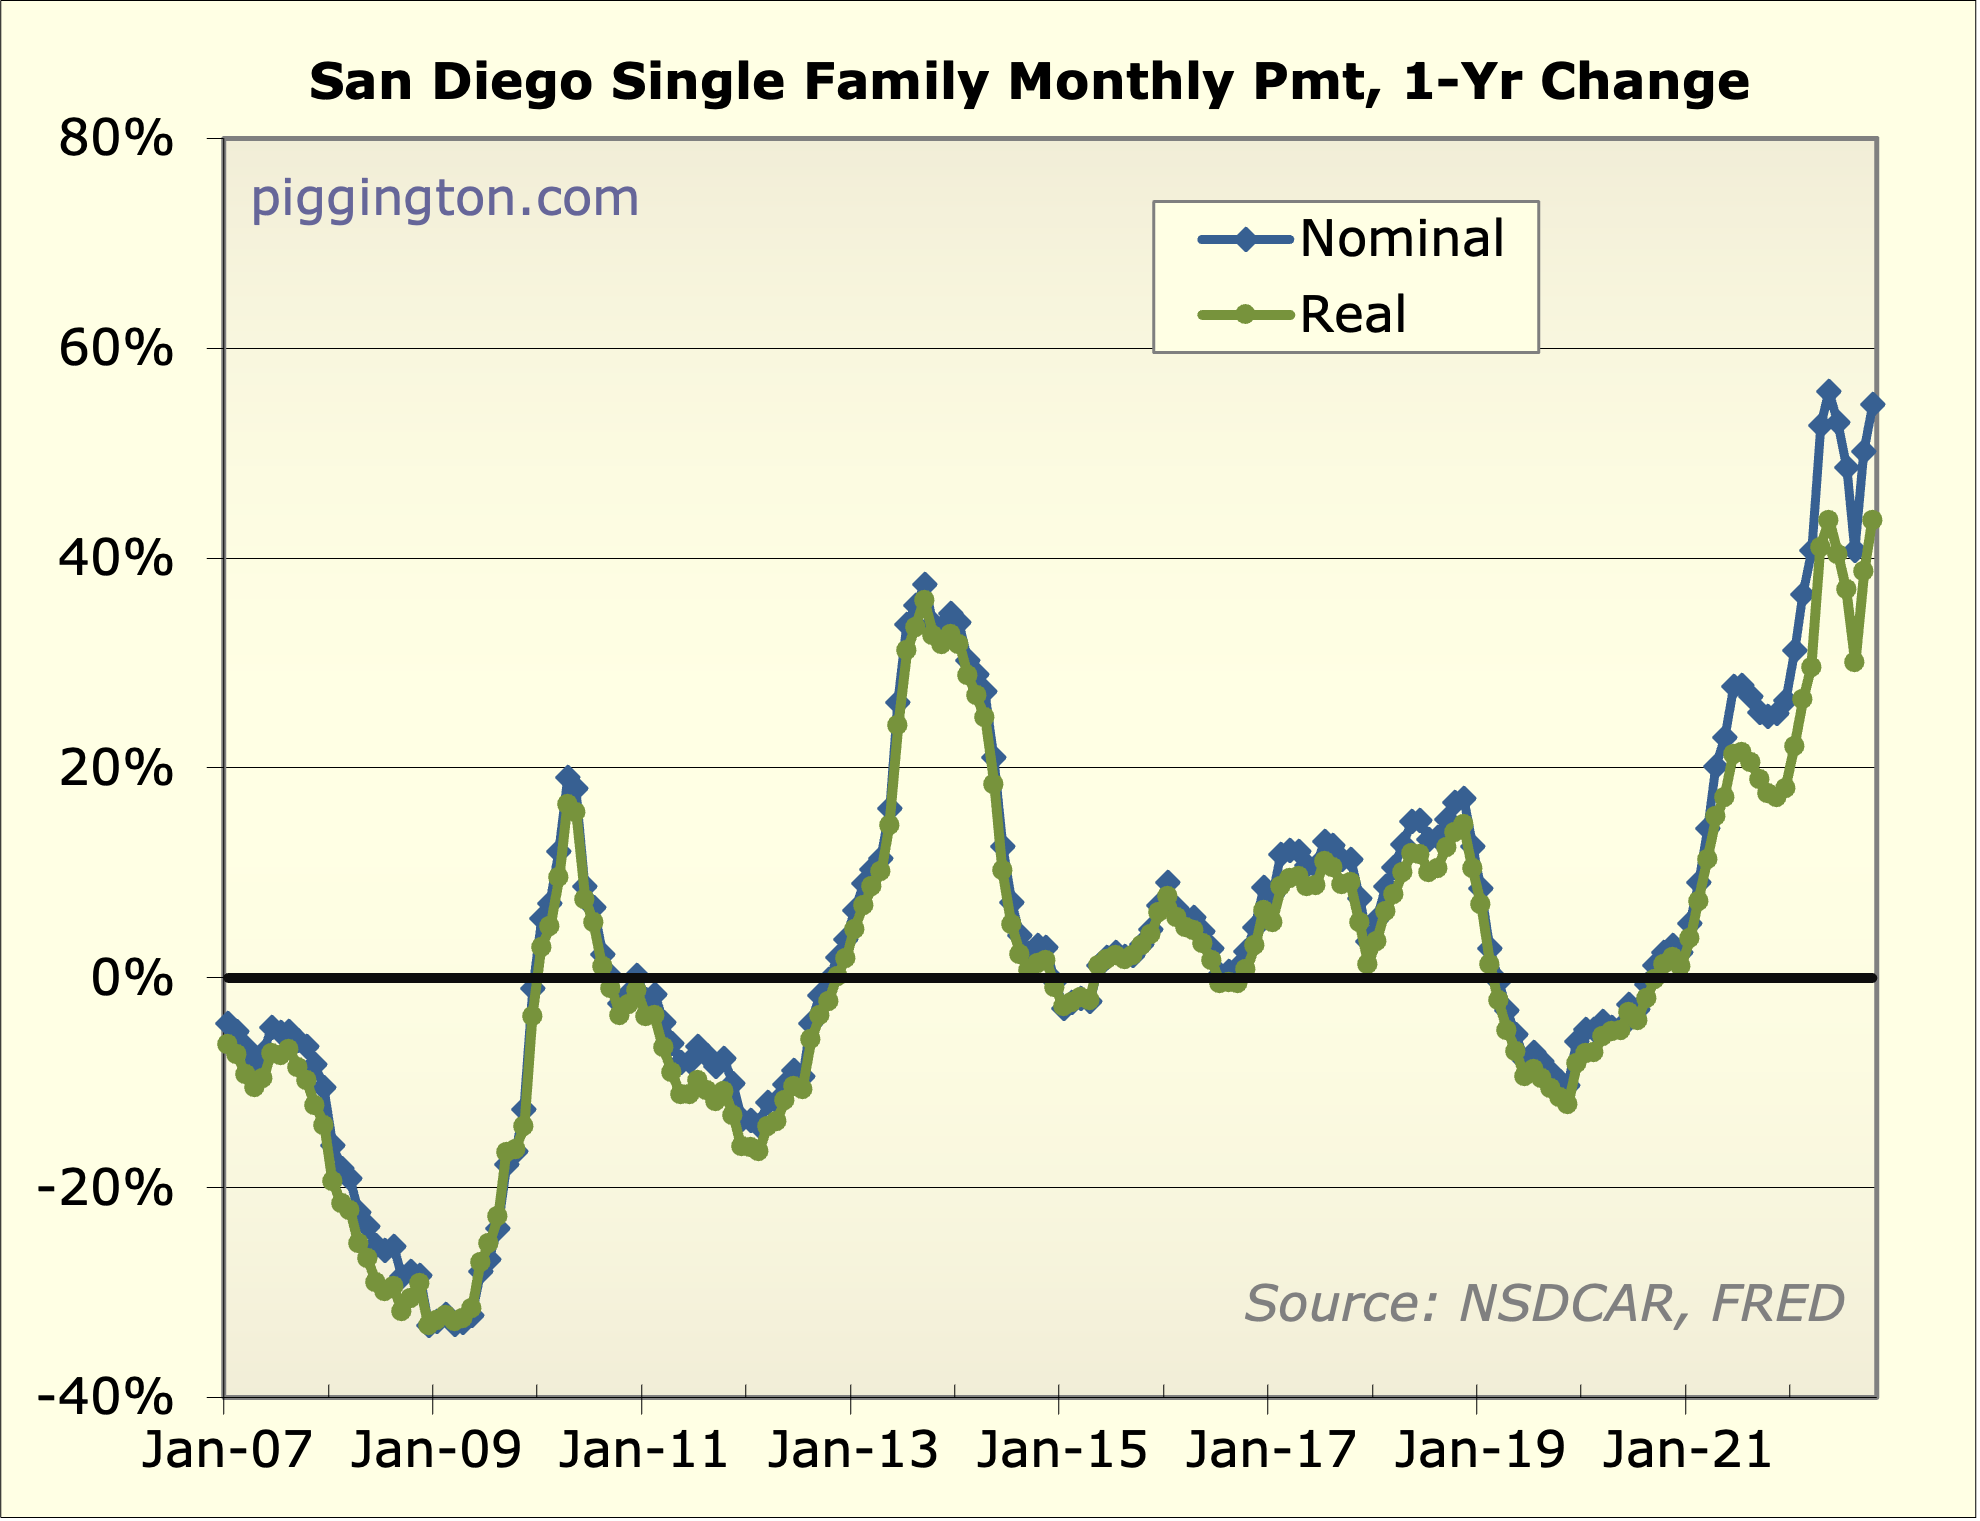
Mortgage rates did not cooperate last month, hitting an average of6.9% for October (30 year mortgage, per FRED). That made for a newhigh in monthly payments, despite the recent decline in home prices:
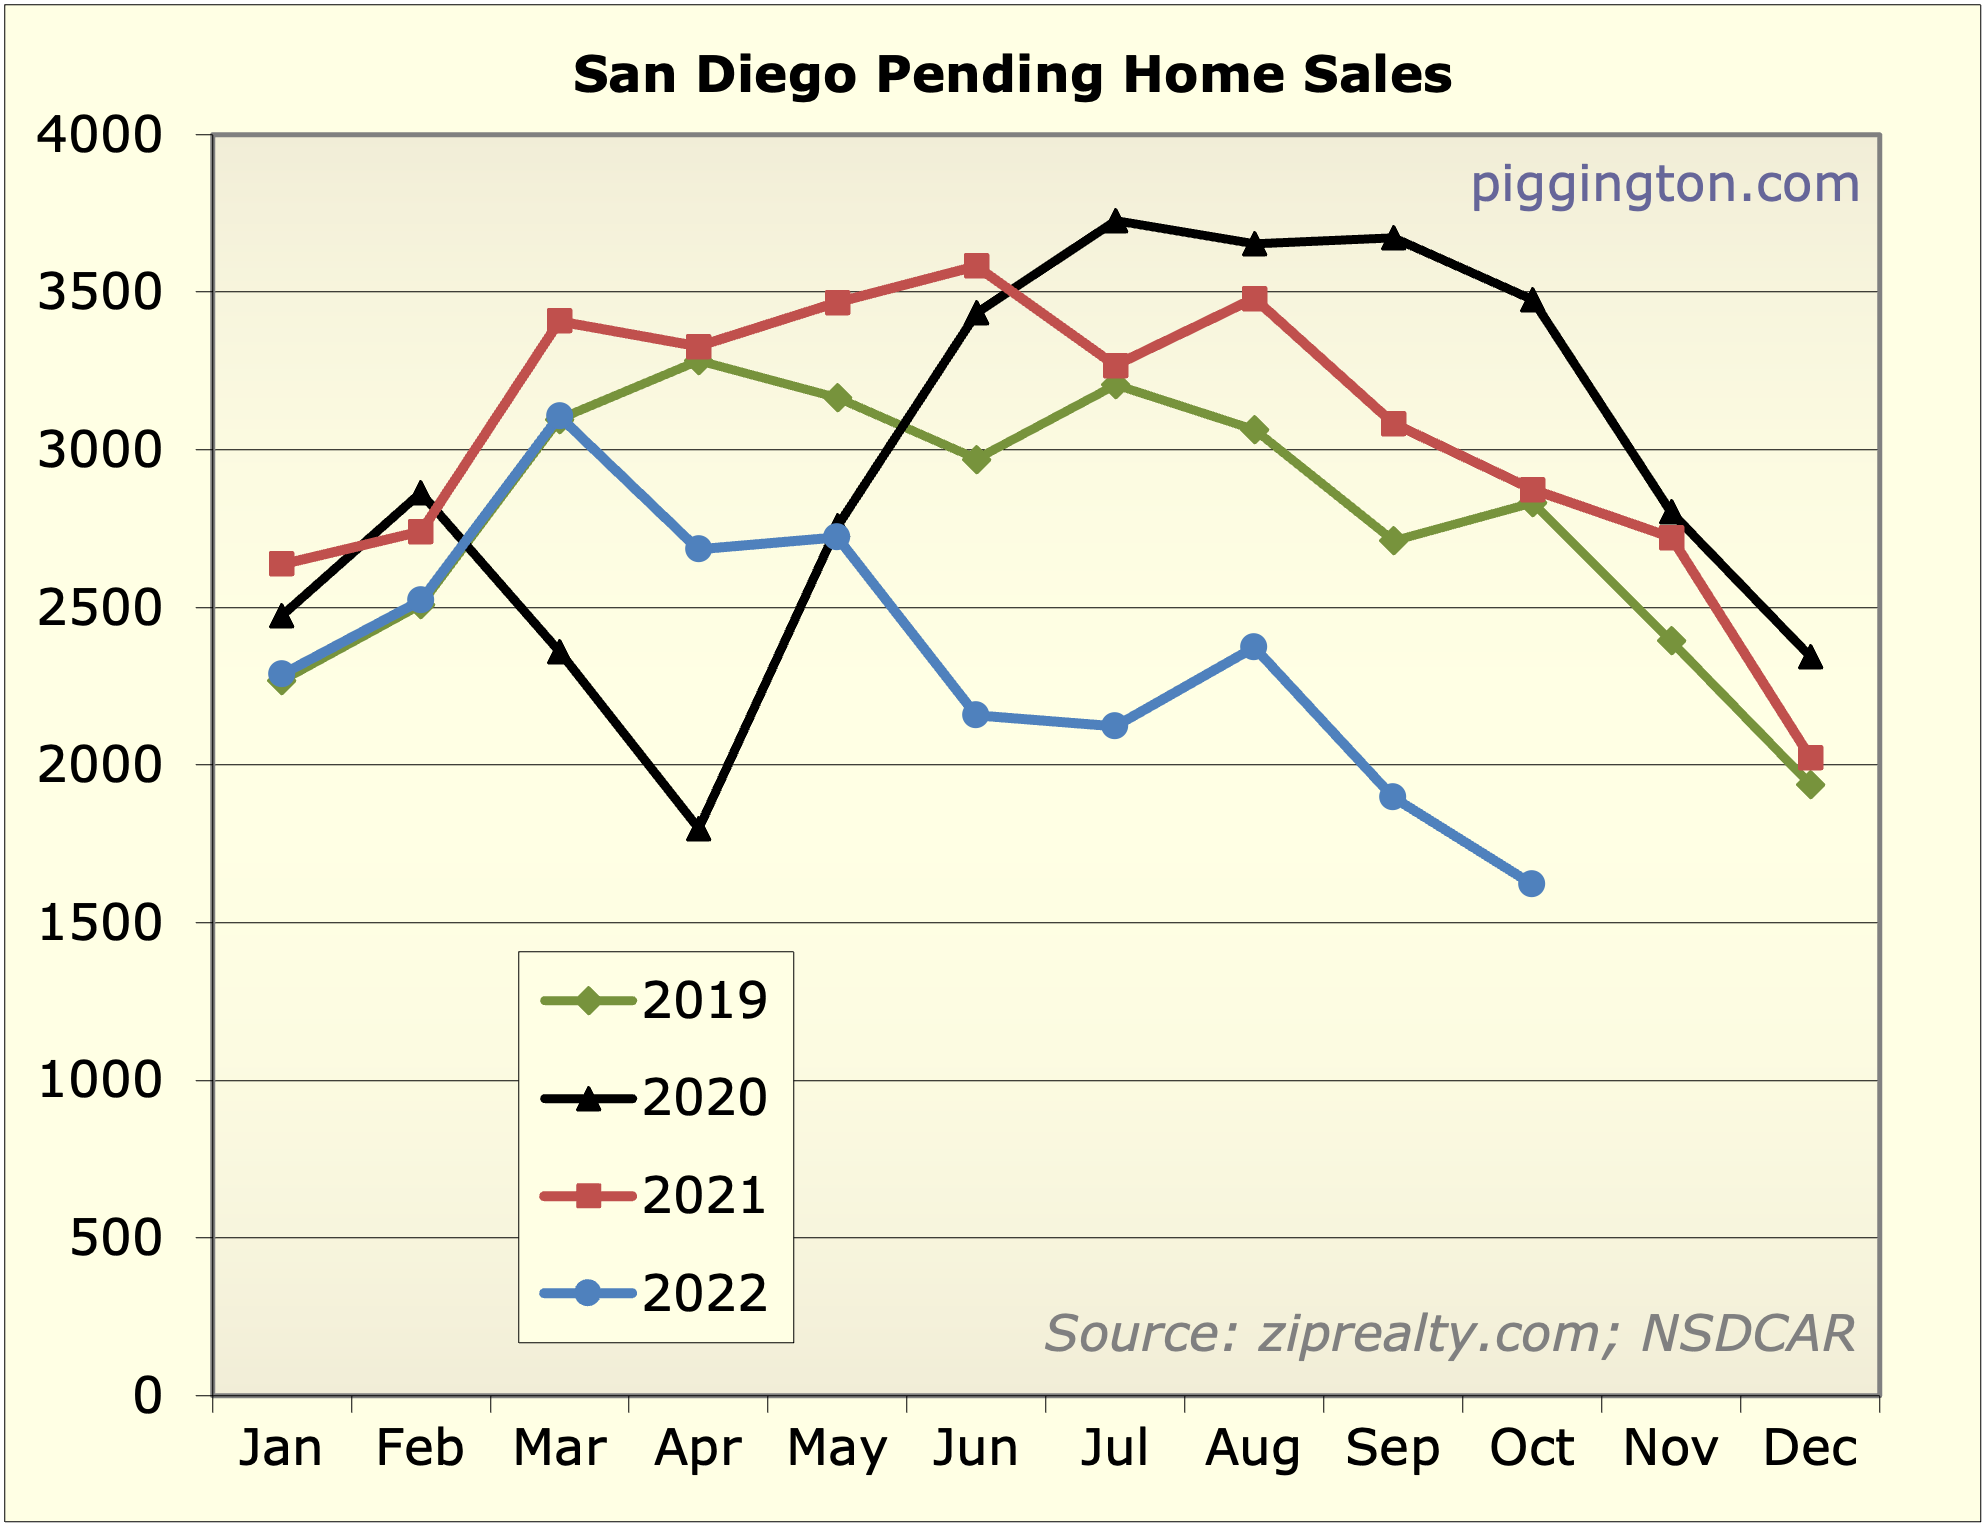
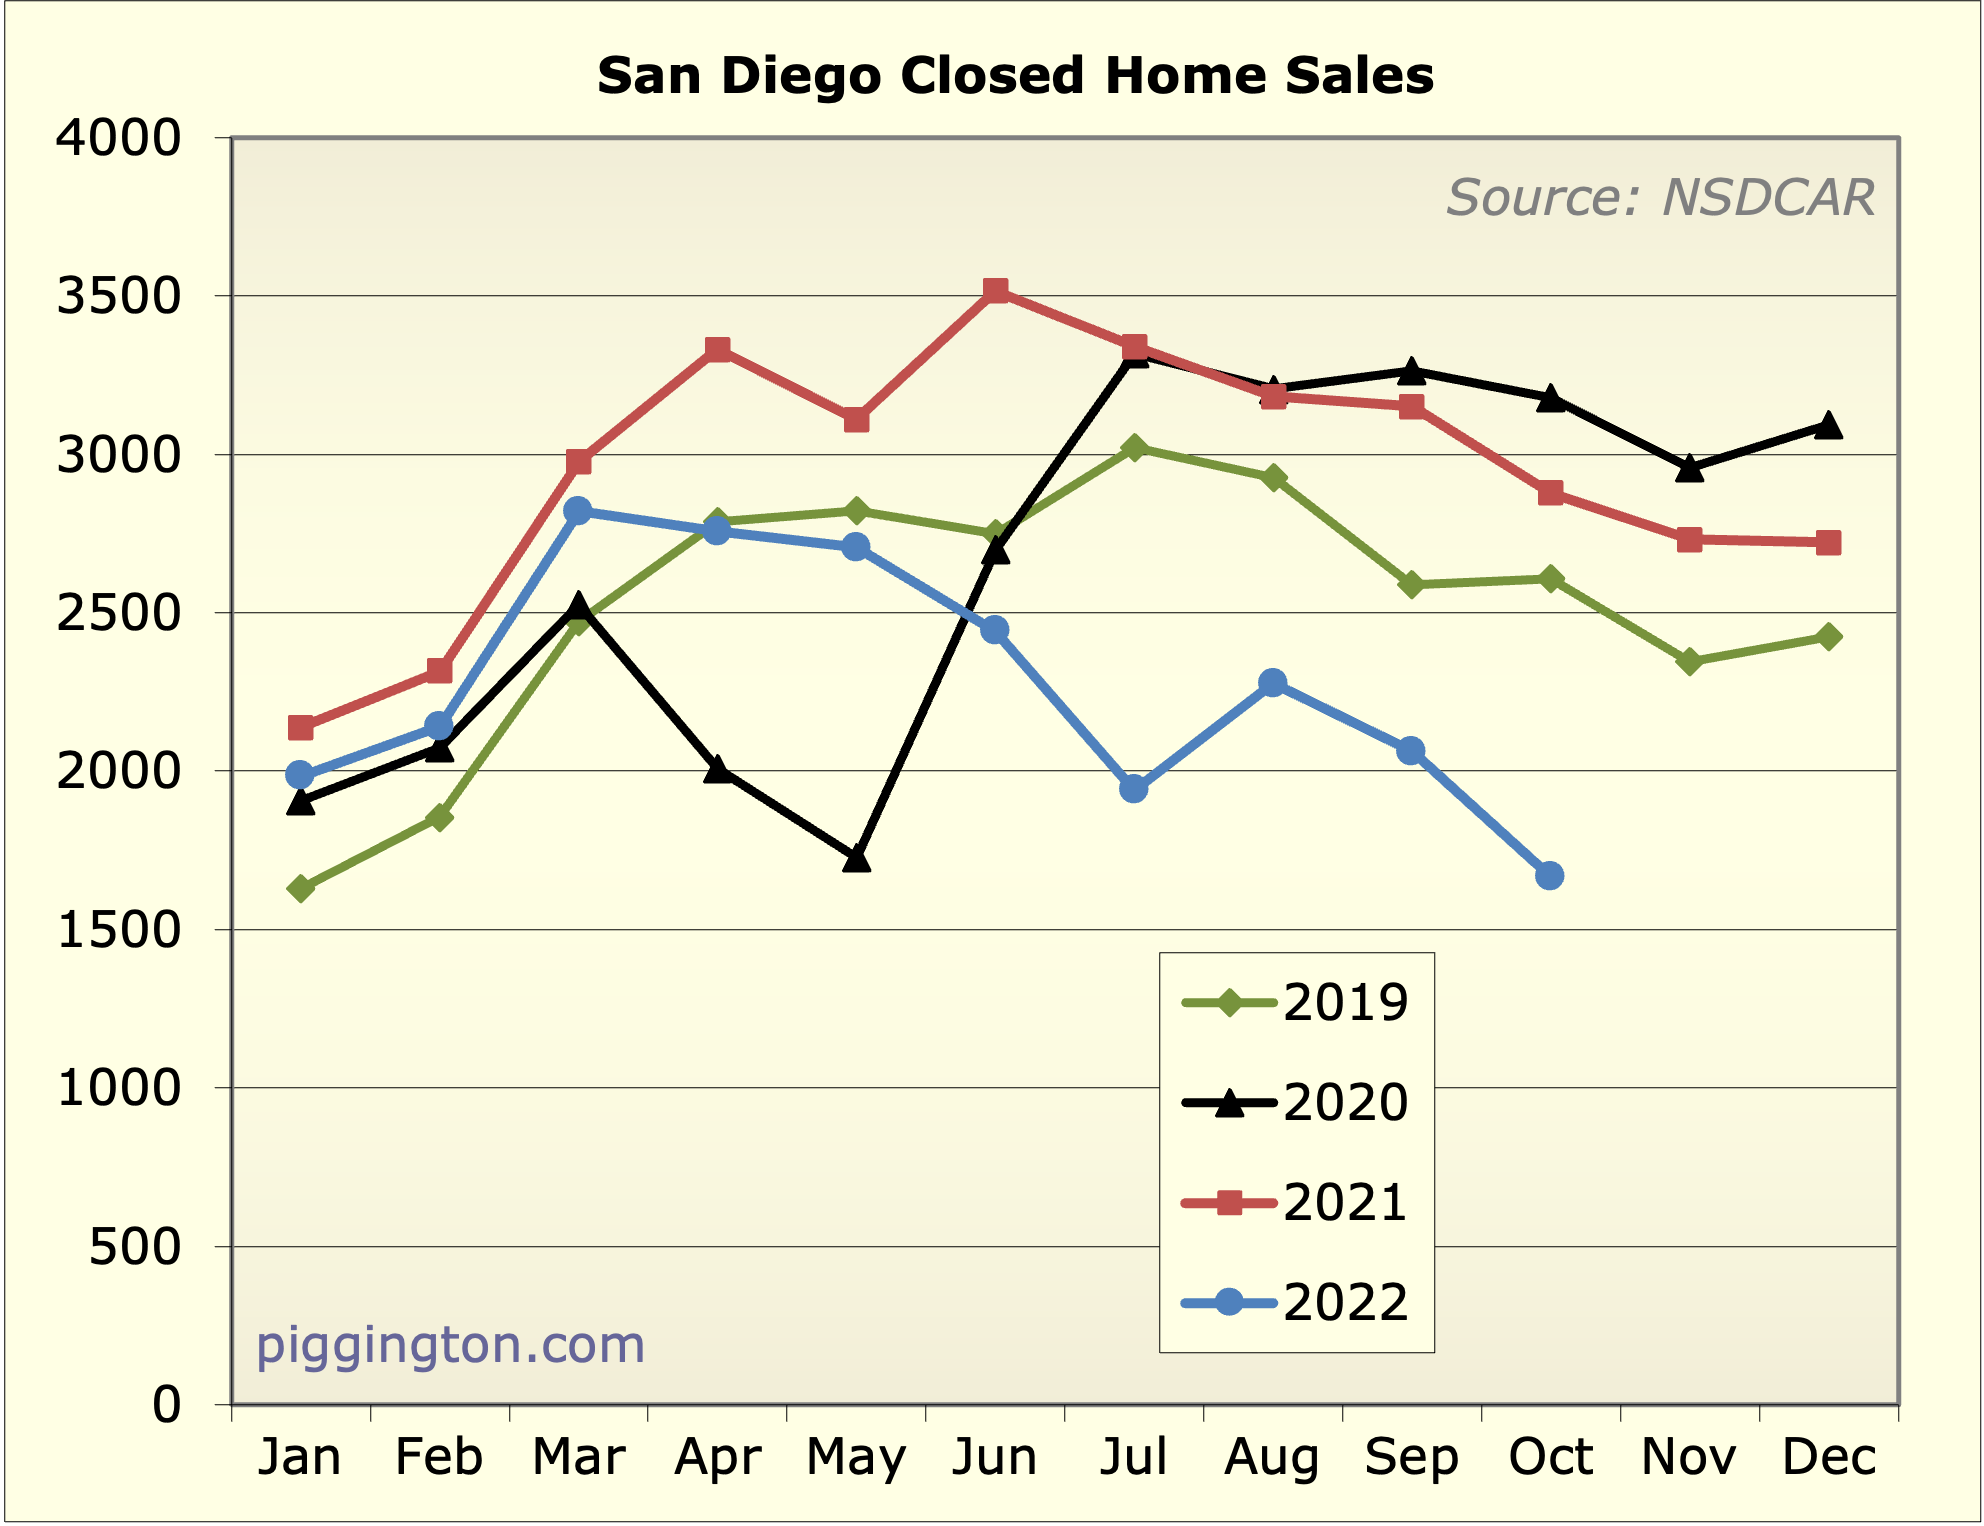
A chart that caught my eye was this one — pending sales havedropped to quite a low level compared to recent years:
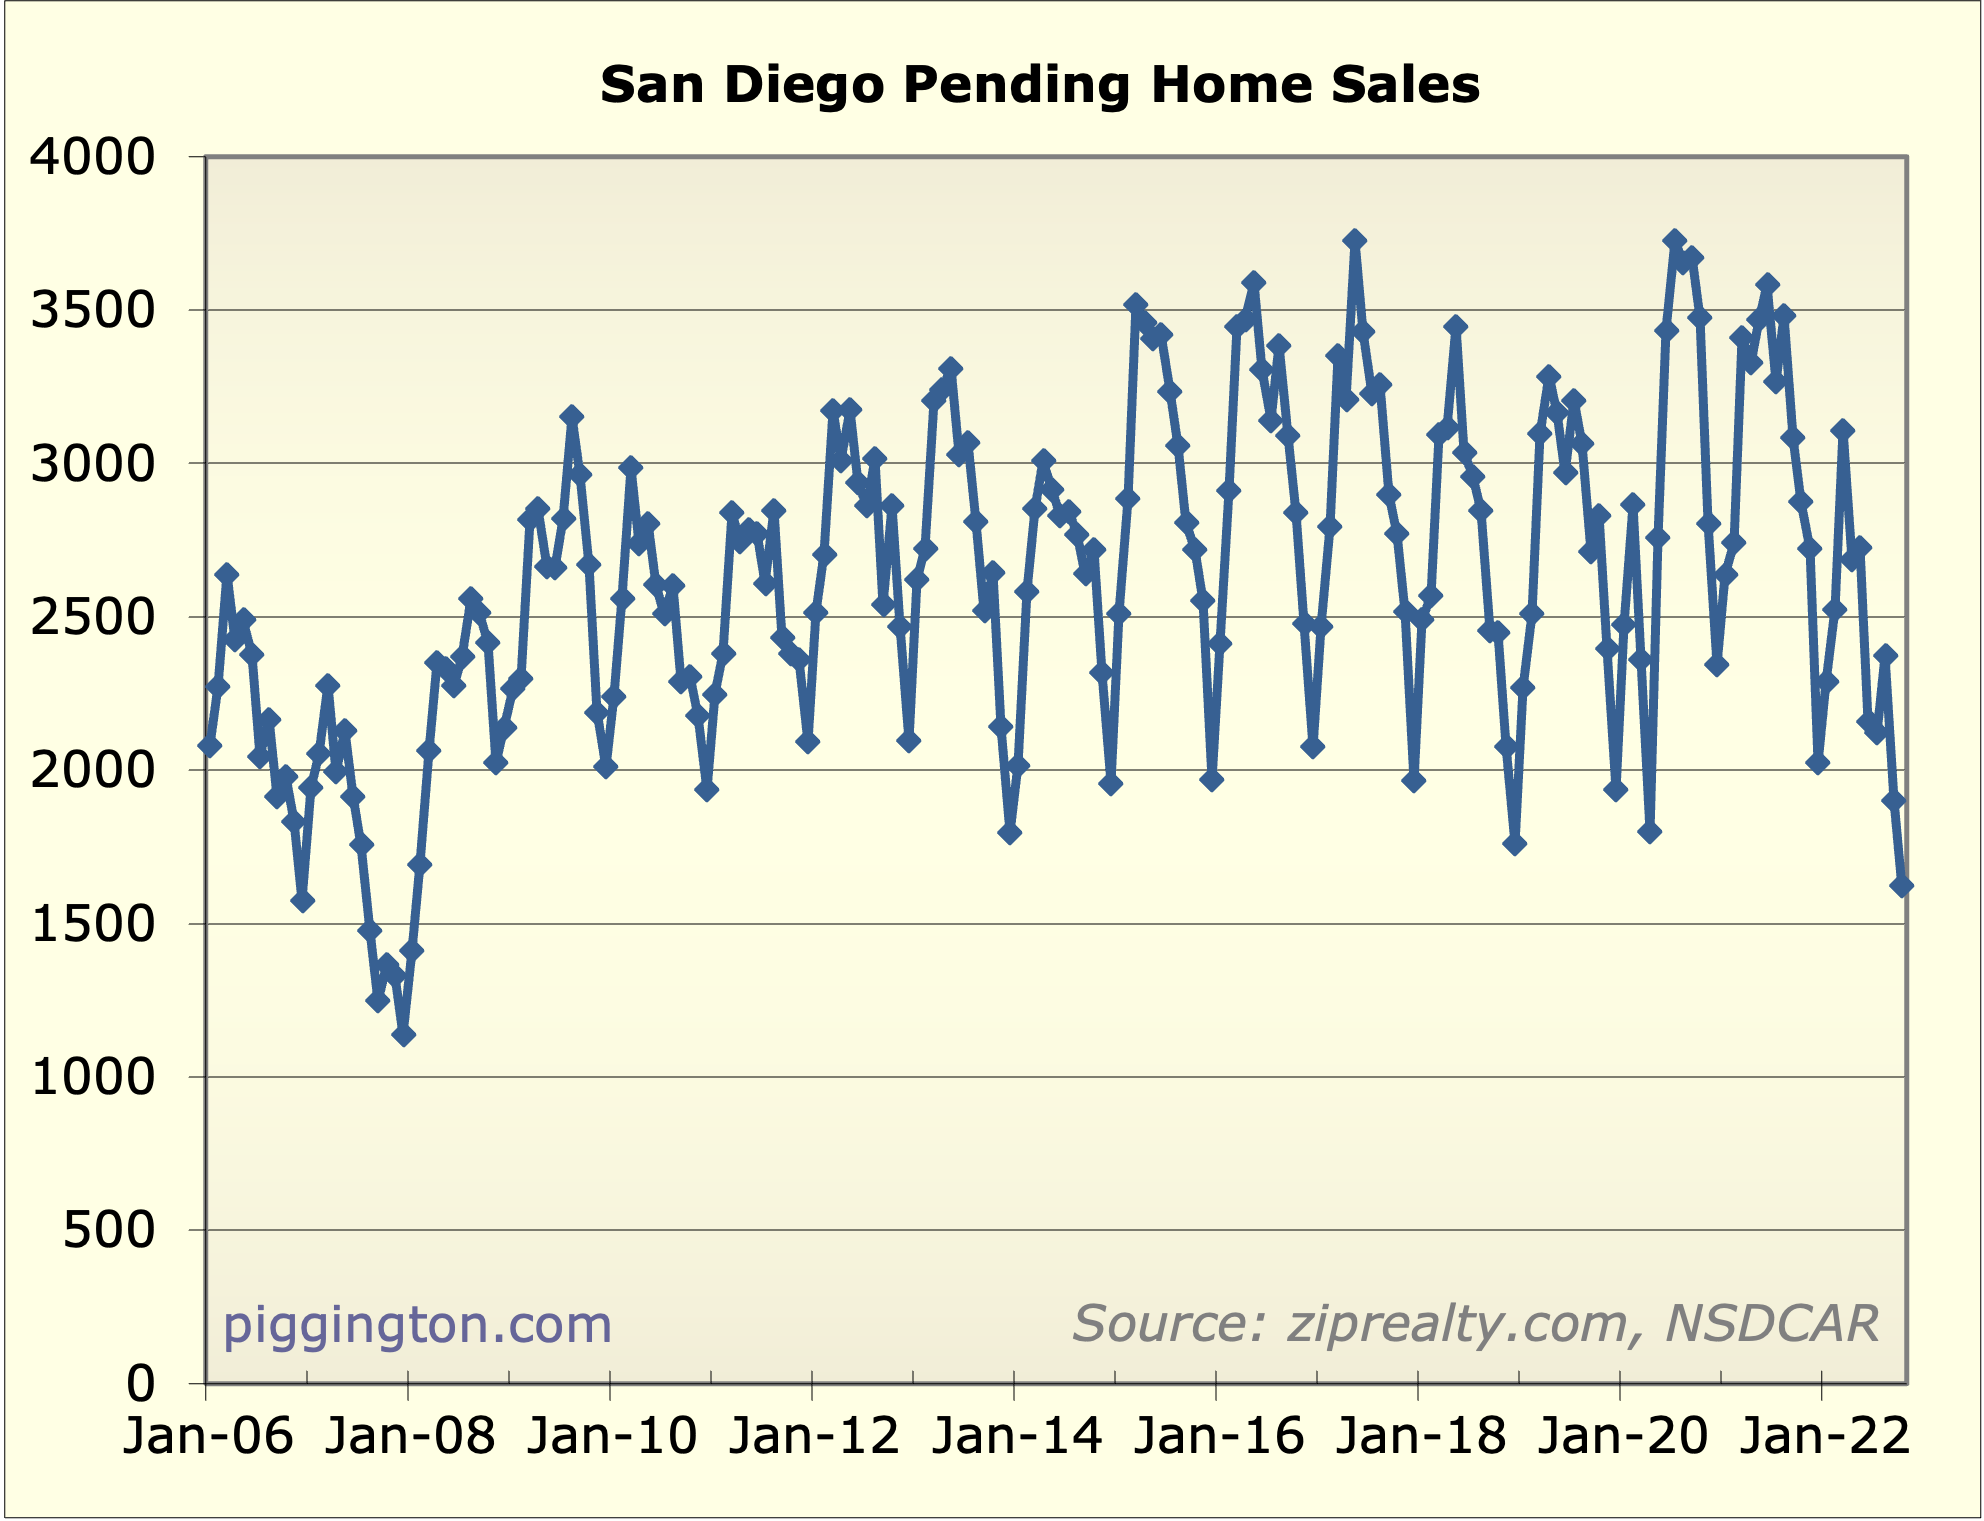
That made me curious about where they stand in the long run, so Imade this graph of monthly pendings going back to 2006. It was evenworse than I expected — October had the smallest number of pendingsales since the GFC!
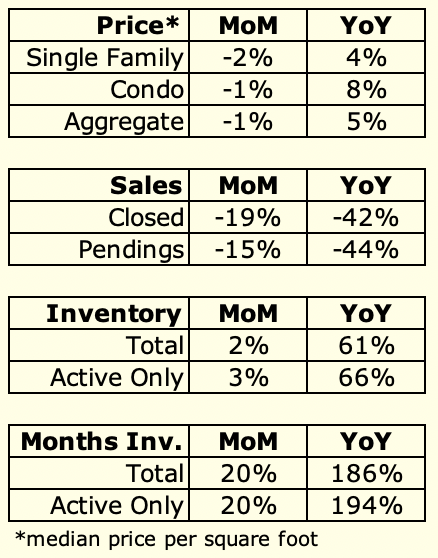
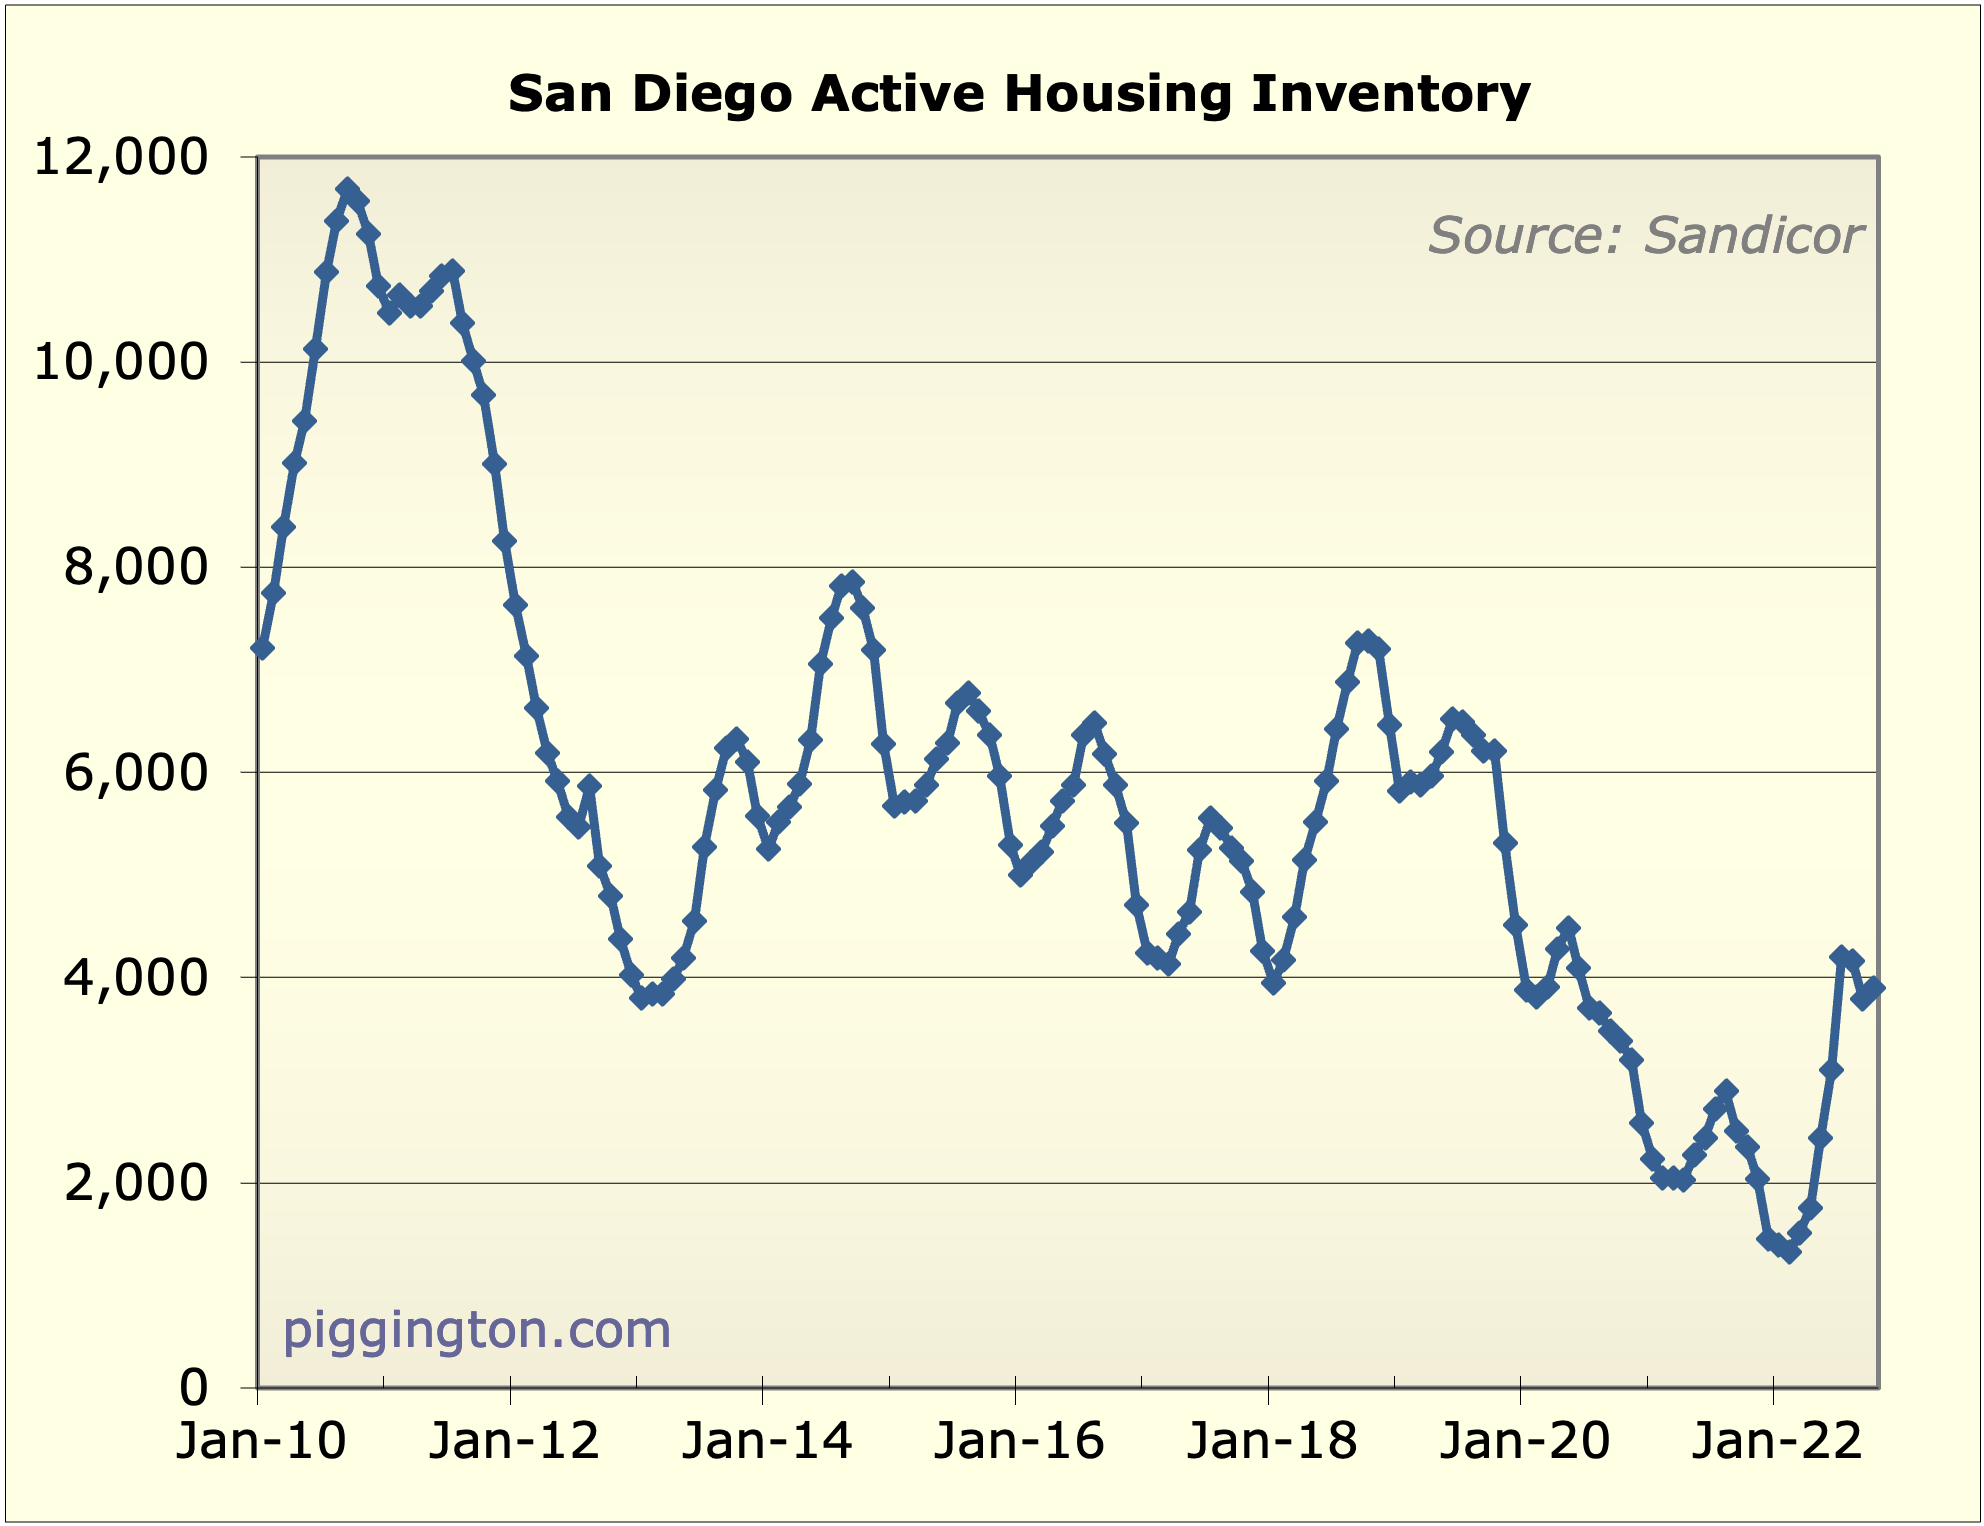
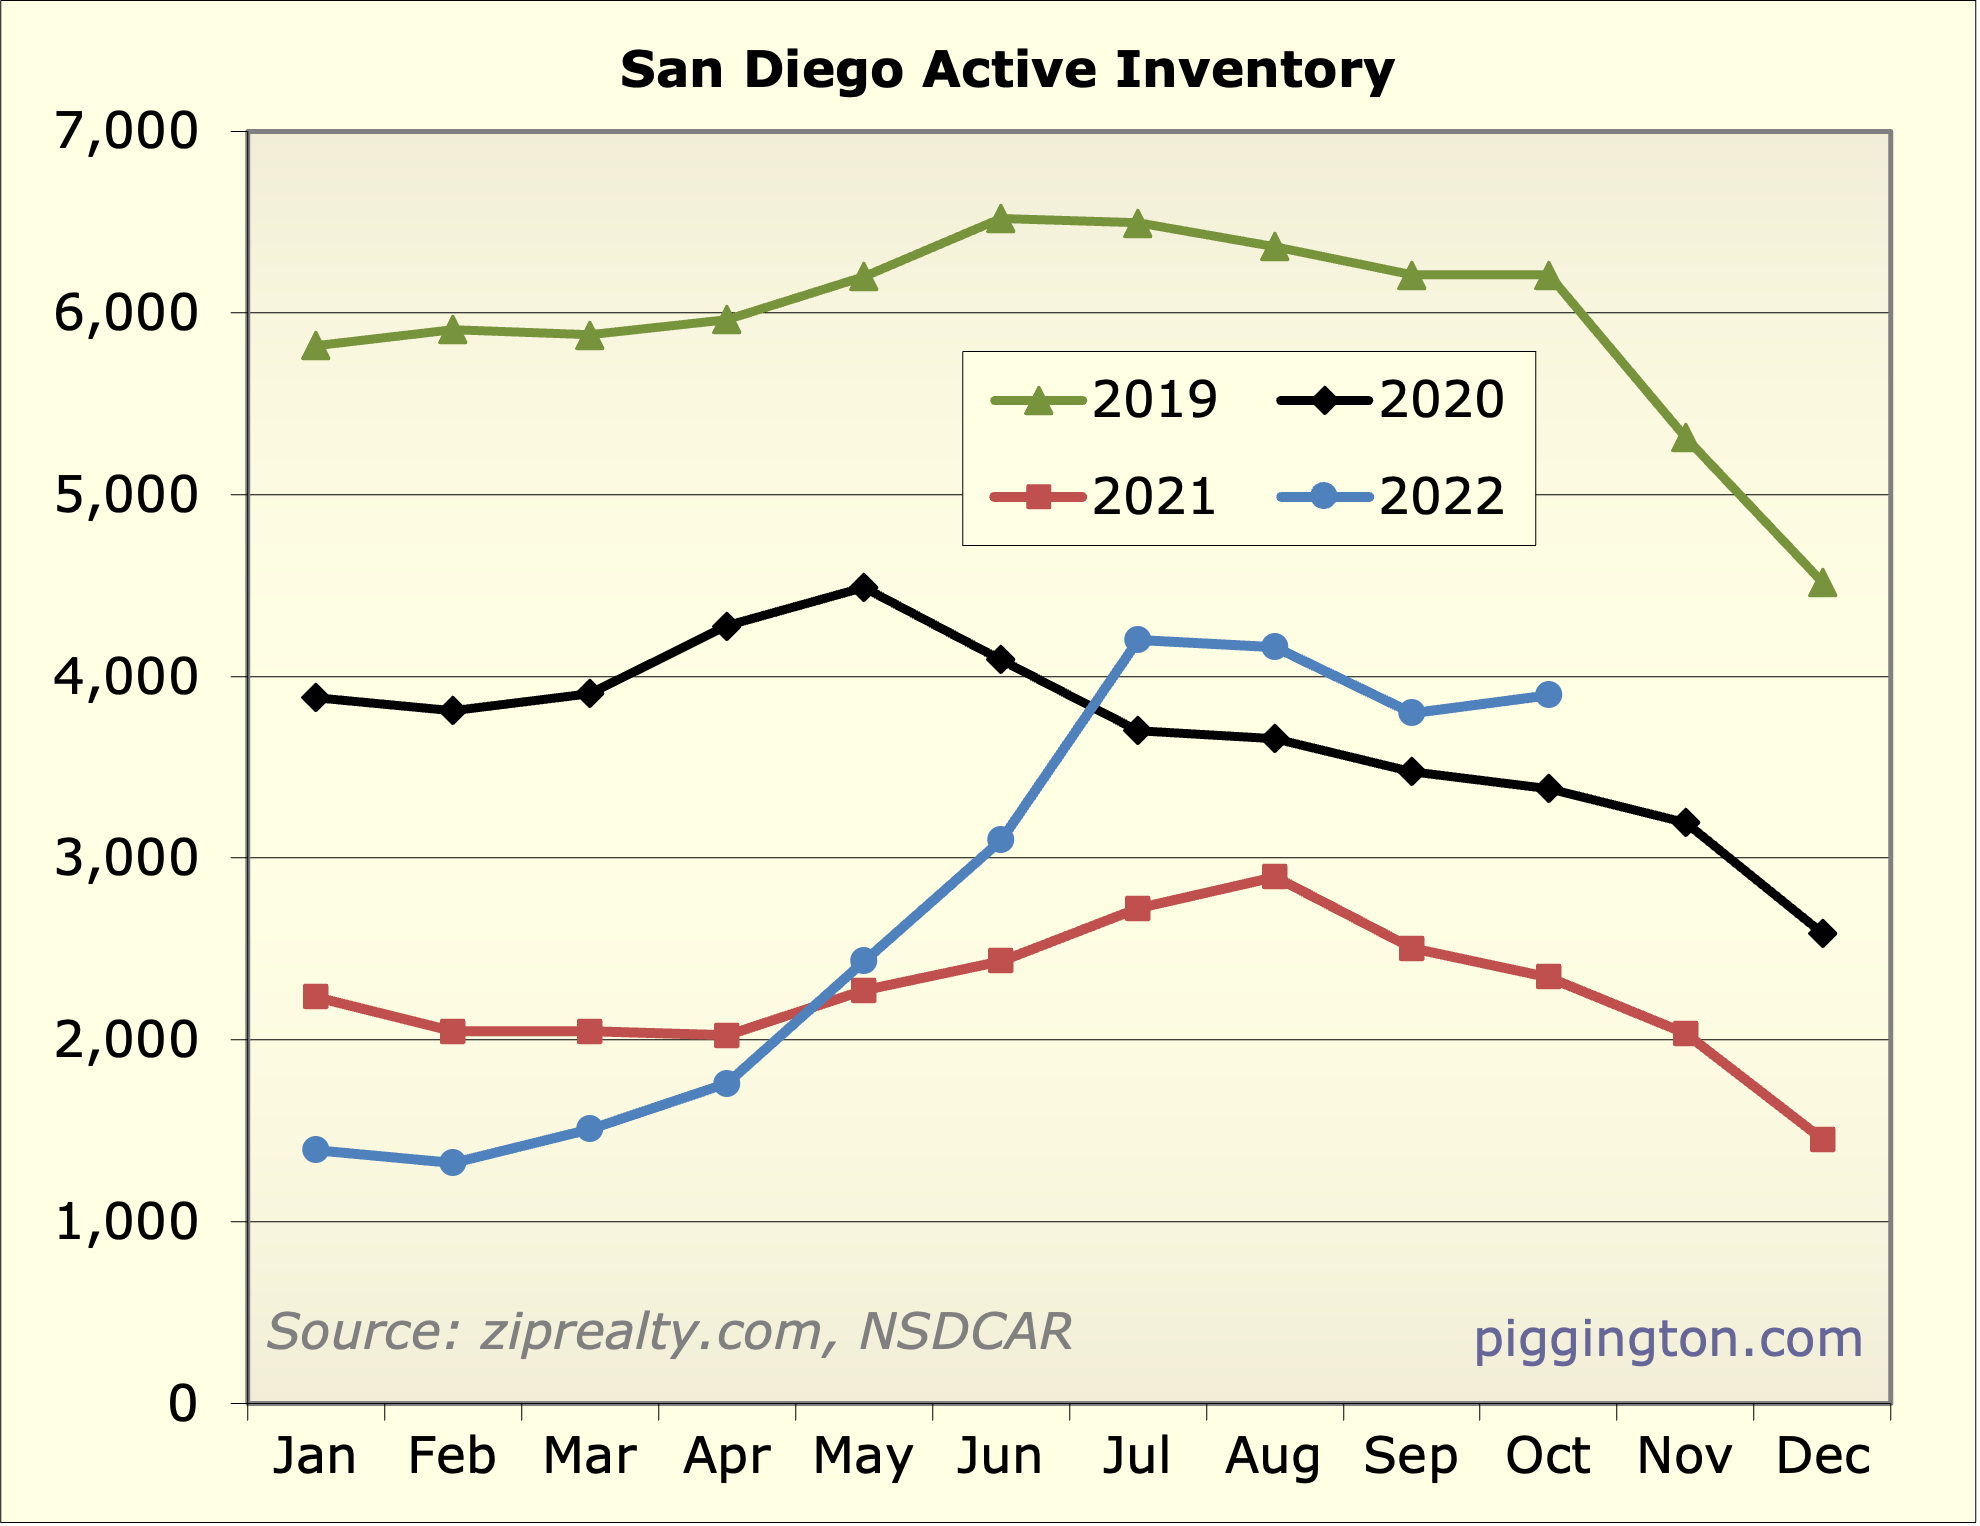
To put that in perspective, that’s happening against a backdrop ofstill fairly low inventory (unlike the GFC):
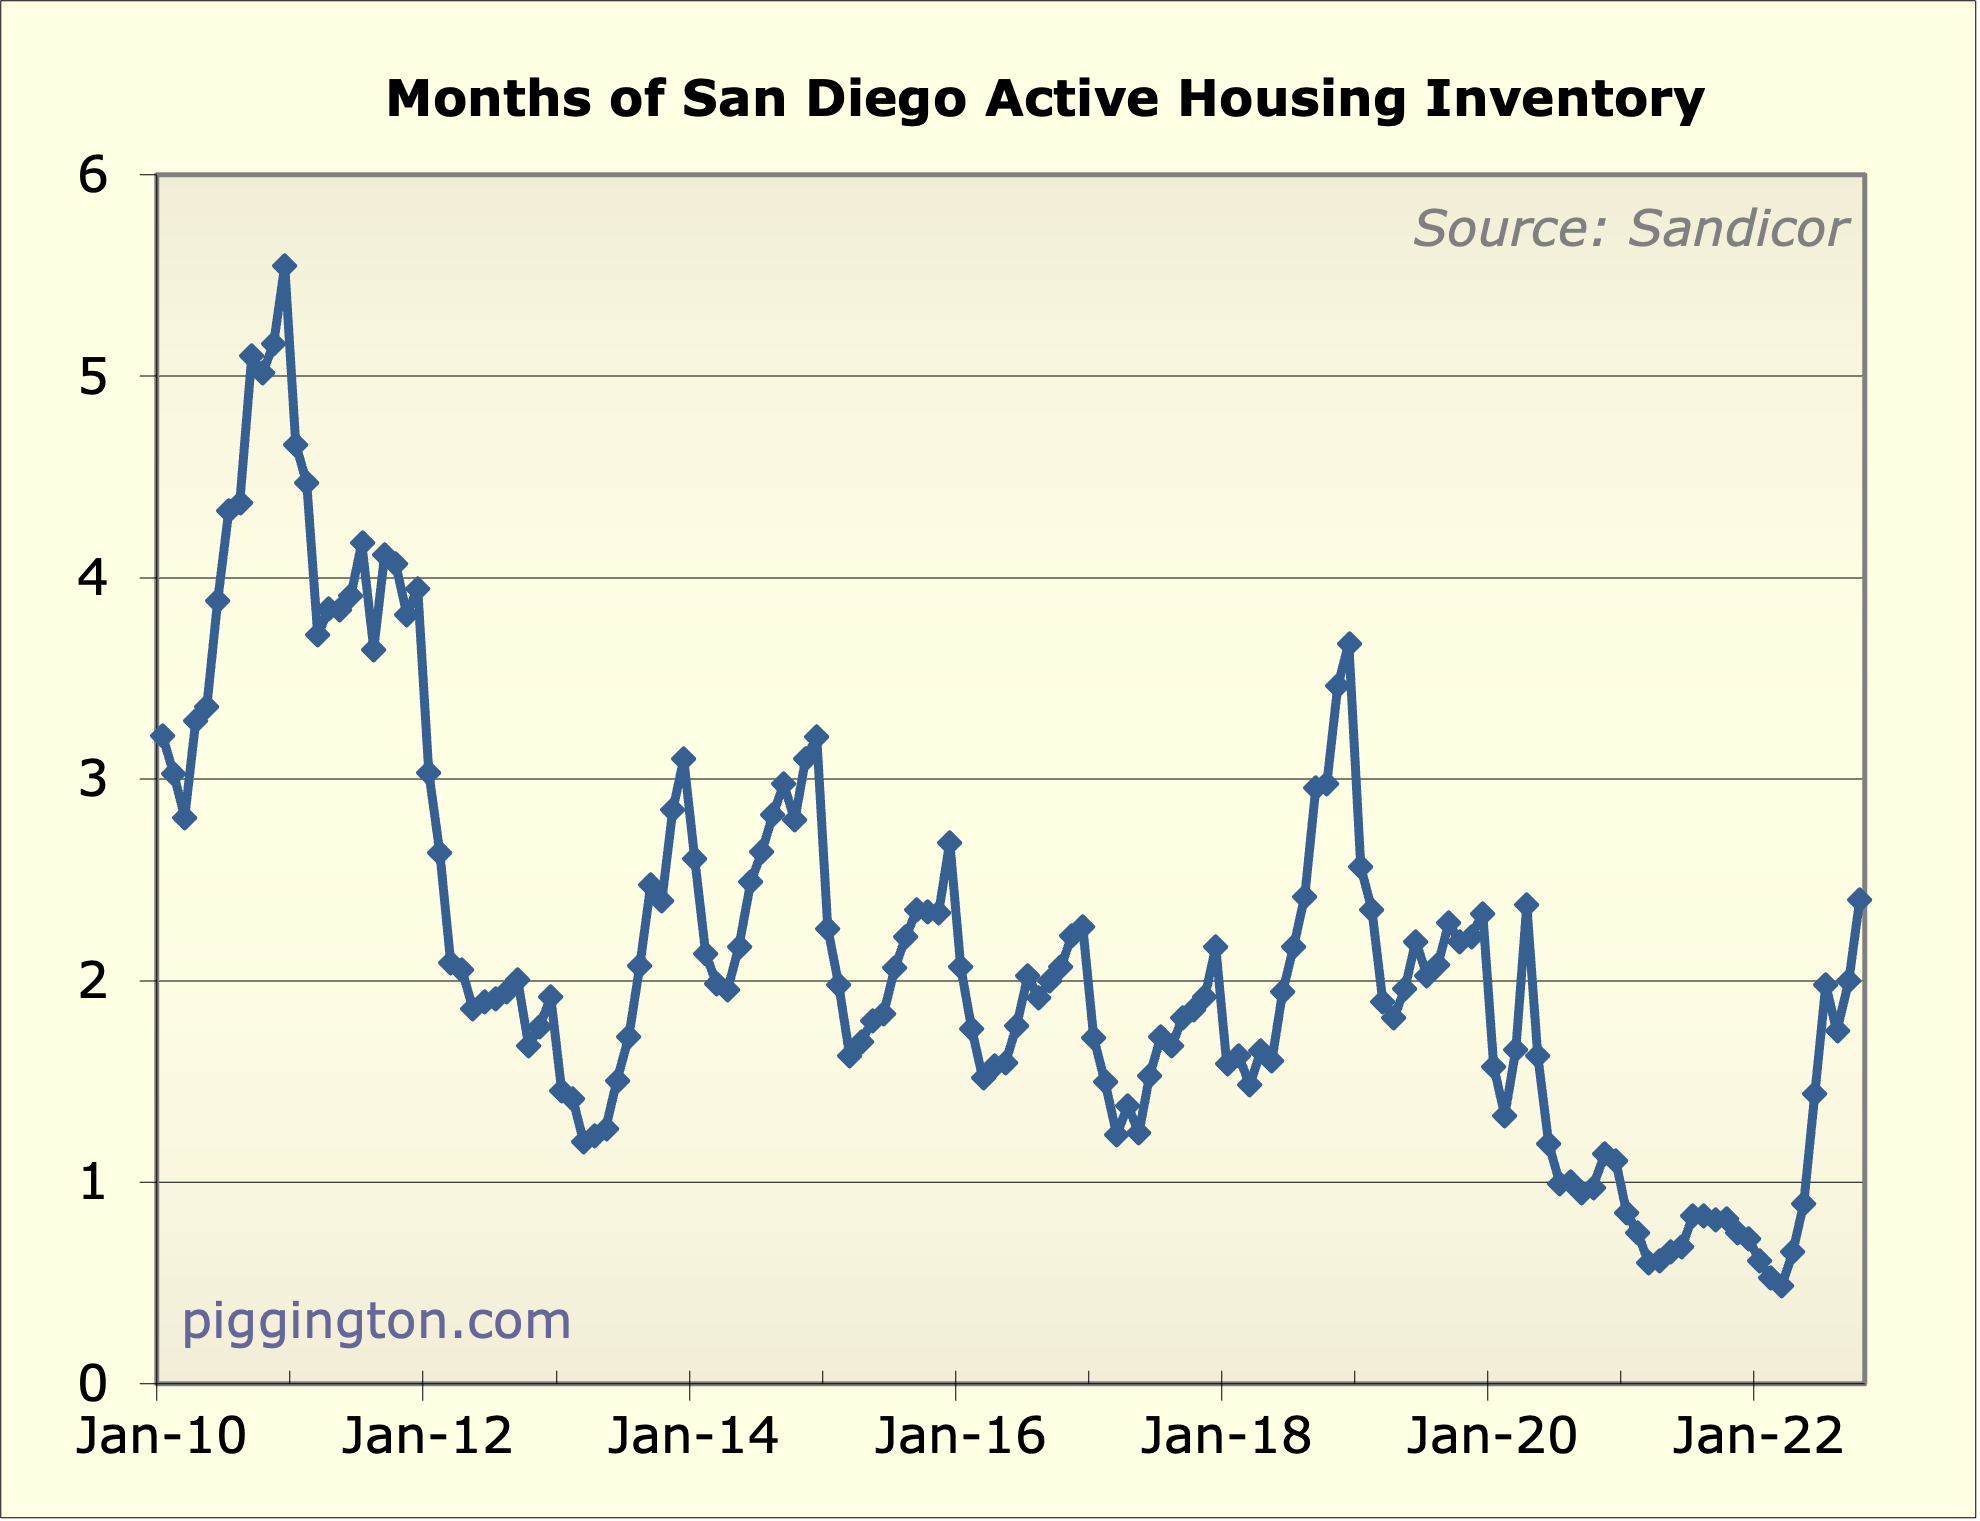
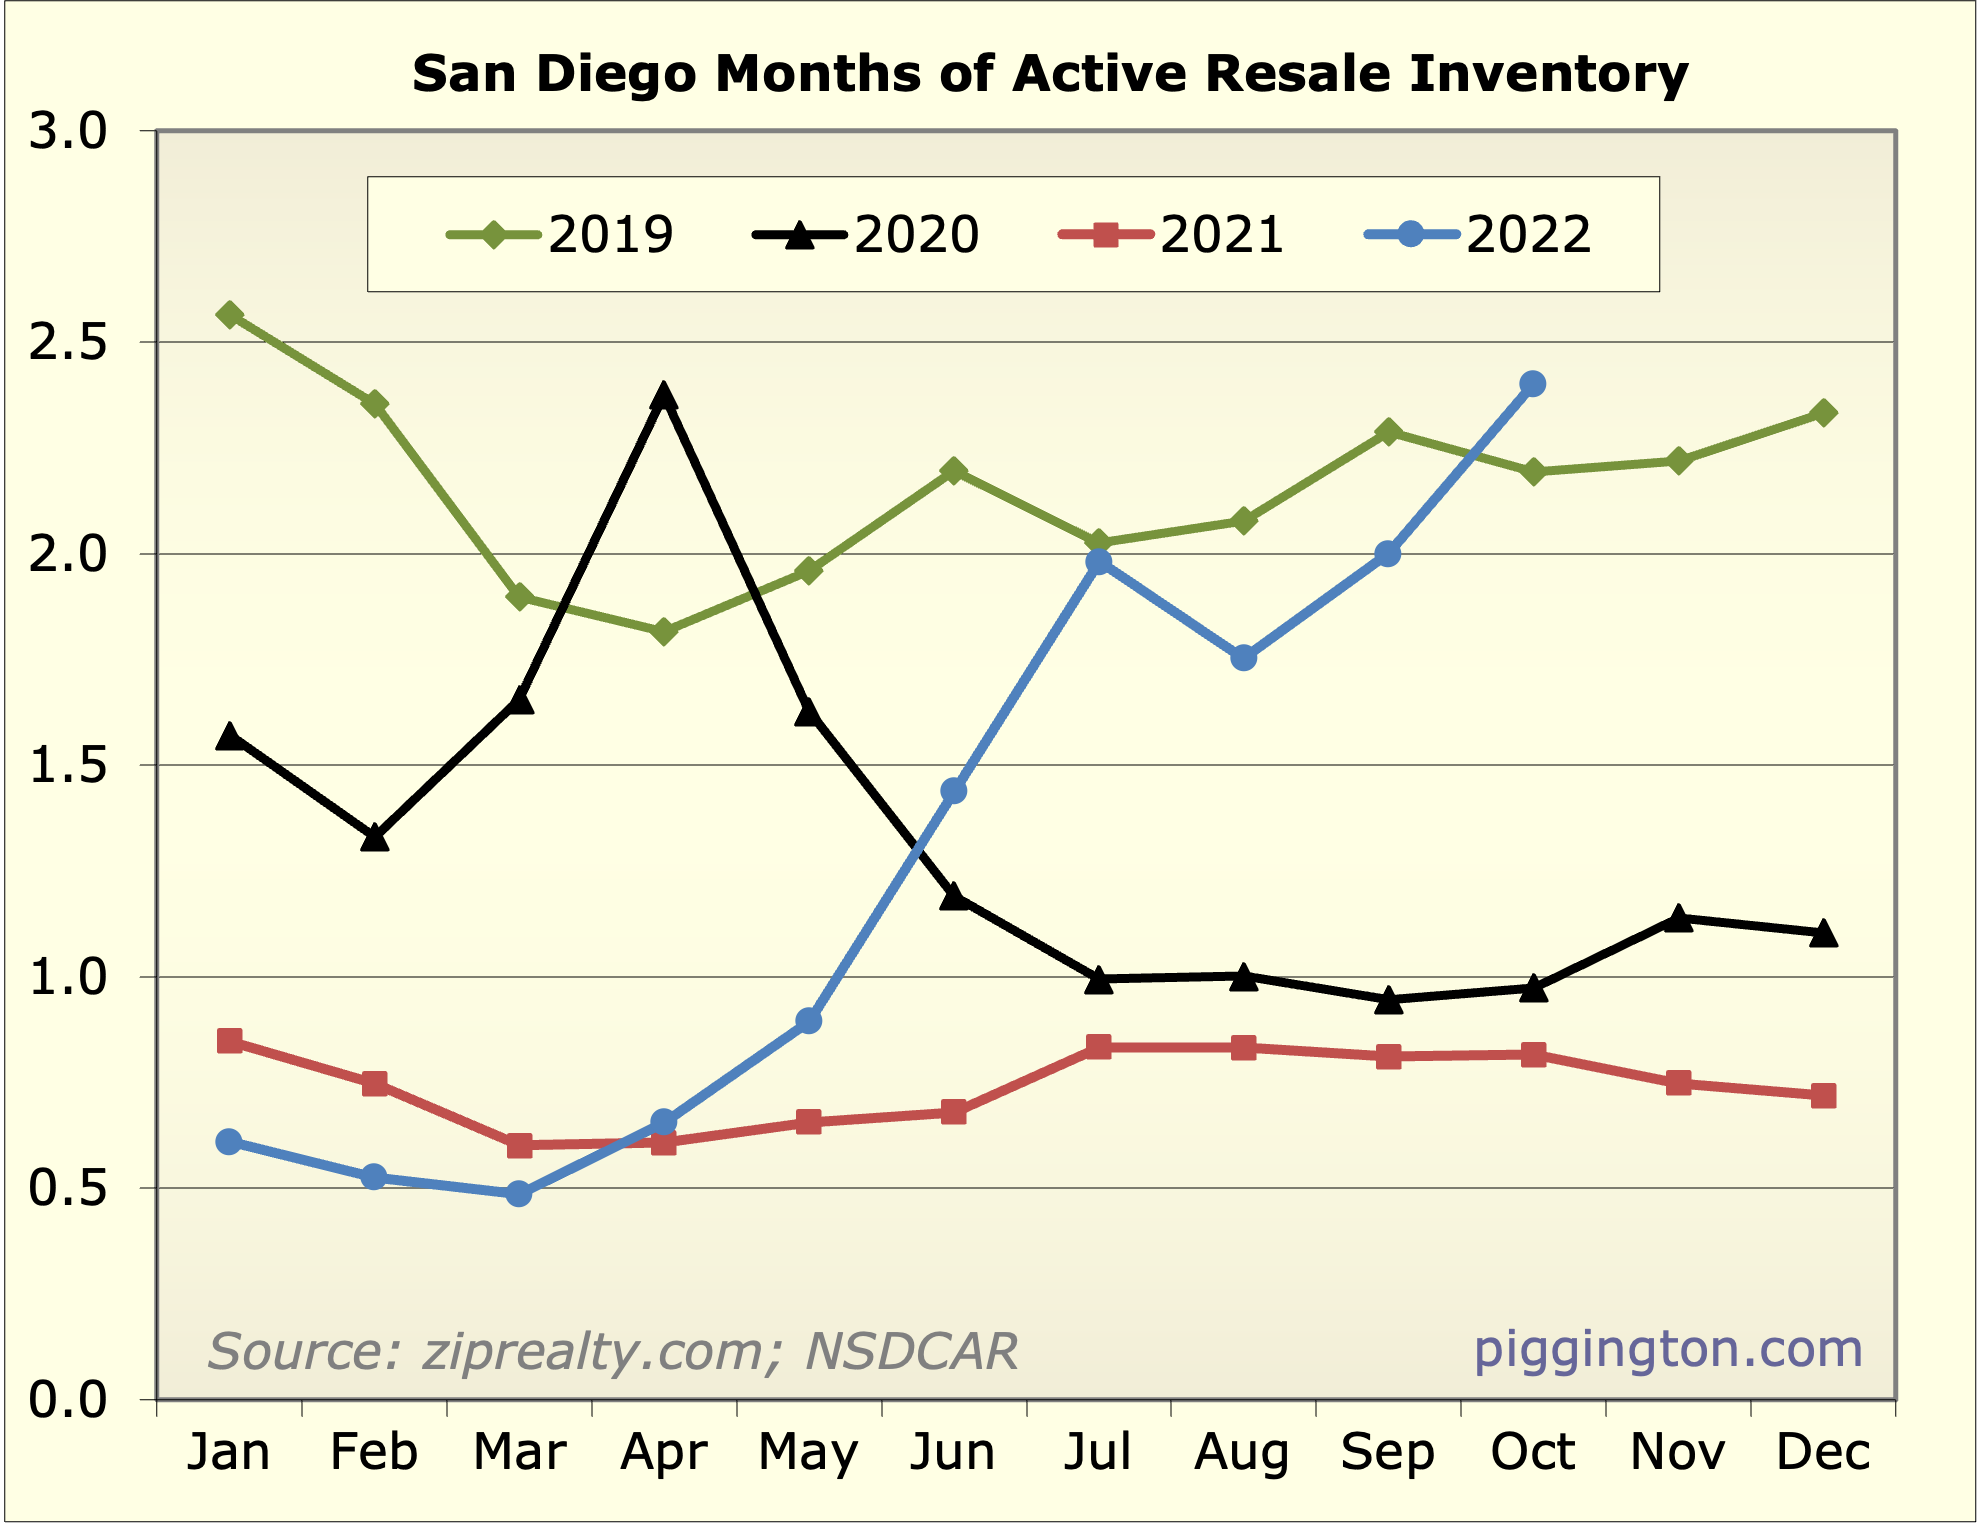
So putting them together, the all-important months-of-inventorylevel is not actually that high:
I think the biggest risk to SD housing is that more inventory comesto market. With the dismal level of demand (at these prices), anincrease in inventory would surely put further downward pressure onprices.
Could it happen? Of course. Yes people generally don’t want to giveup their <3% mortgages, and so forth… but when it comes down toit, sometimes people have to sell. Bear in mind that the current lowinventory environment happens to be taking place during a boomingjob market. If we get a recession, (resulting in job loss orrelocation — yes, sometimes people still have to live in the samecity as their employer) it seems very likely that more inventorywill find its way to the market.
Offsetting that concern, an economic slowdown would likely beaccompanied by declining mortgage rates, which might ramp demandback up due to increased affordability. Still — my thinking is thatthe housing market’s biggest vulnerability is the possibility thateconomic weakness will bring on new supply in the face of extremelyweak demand.
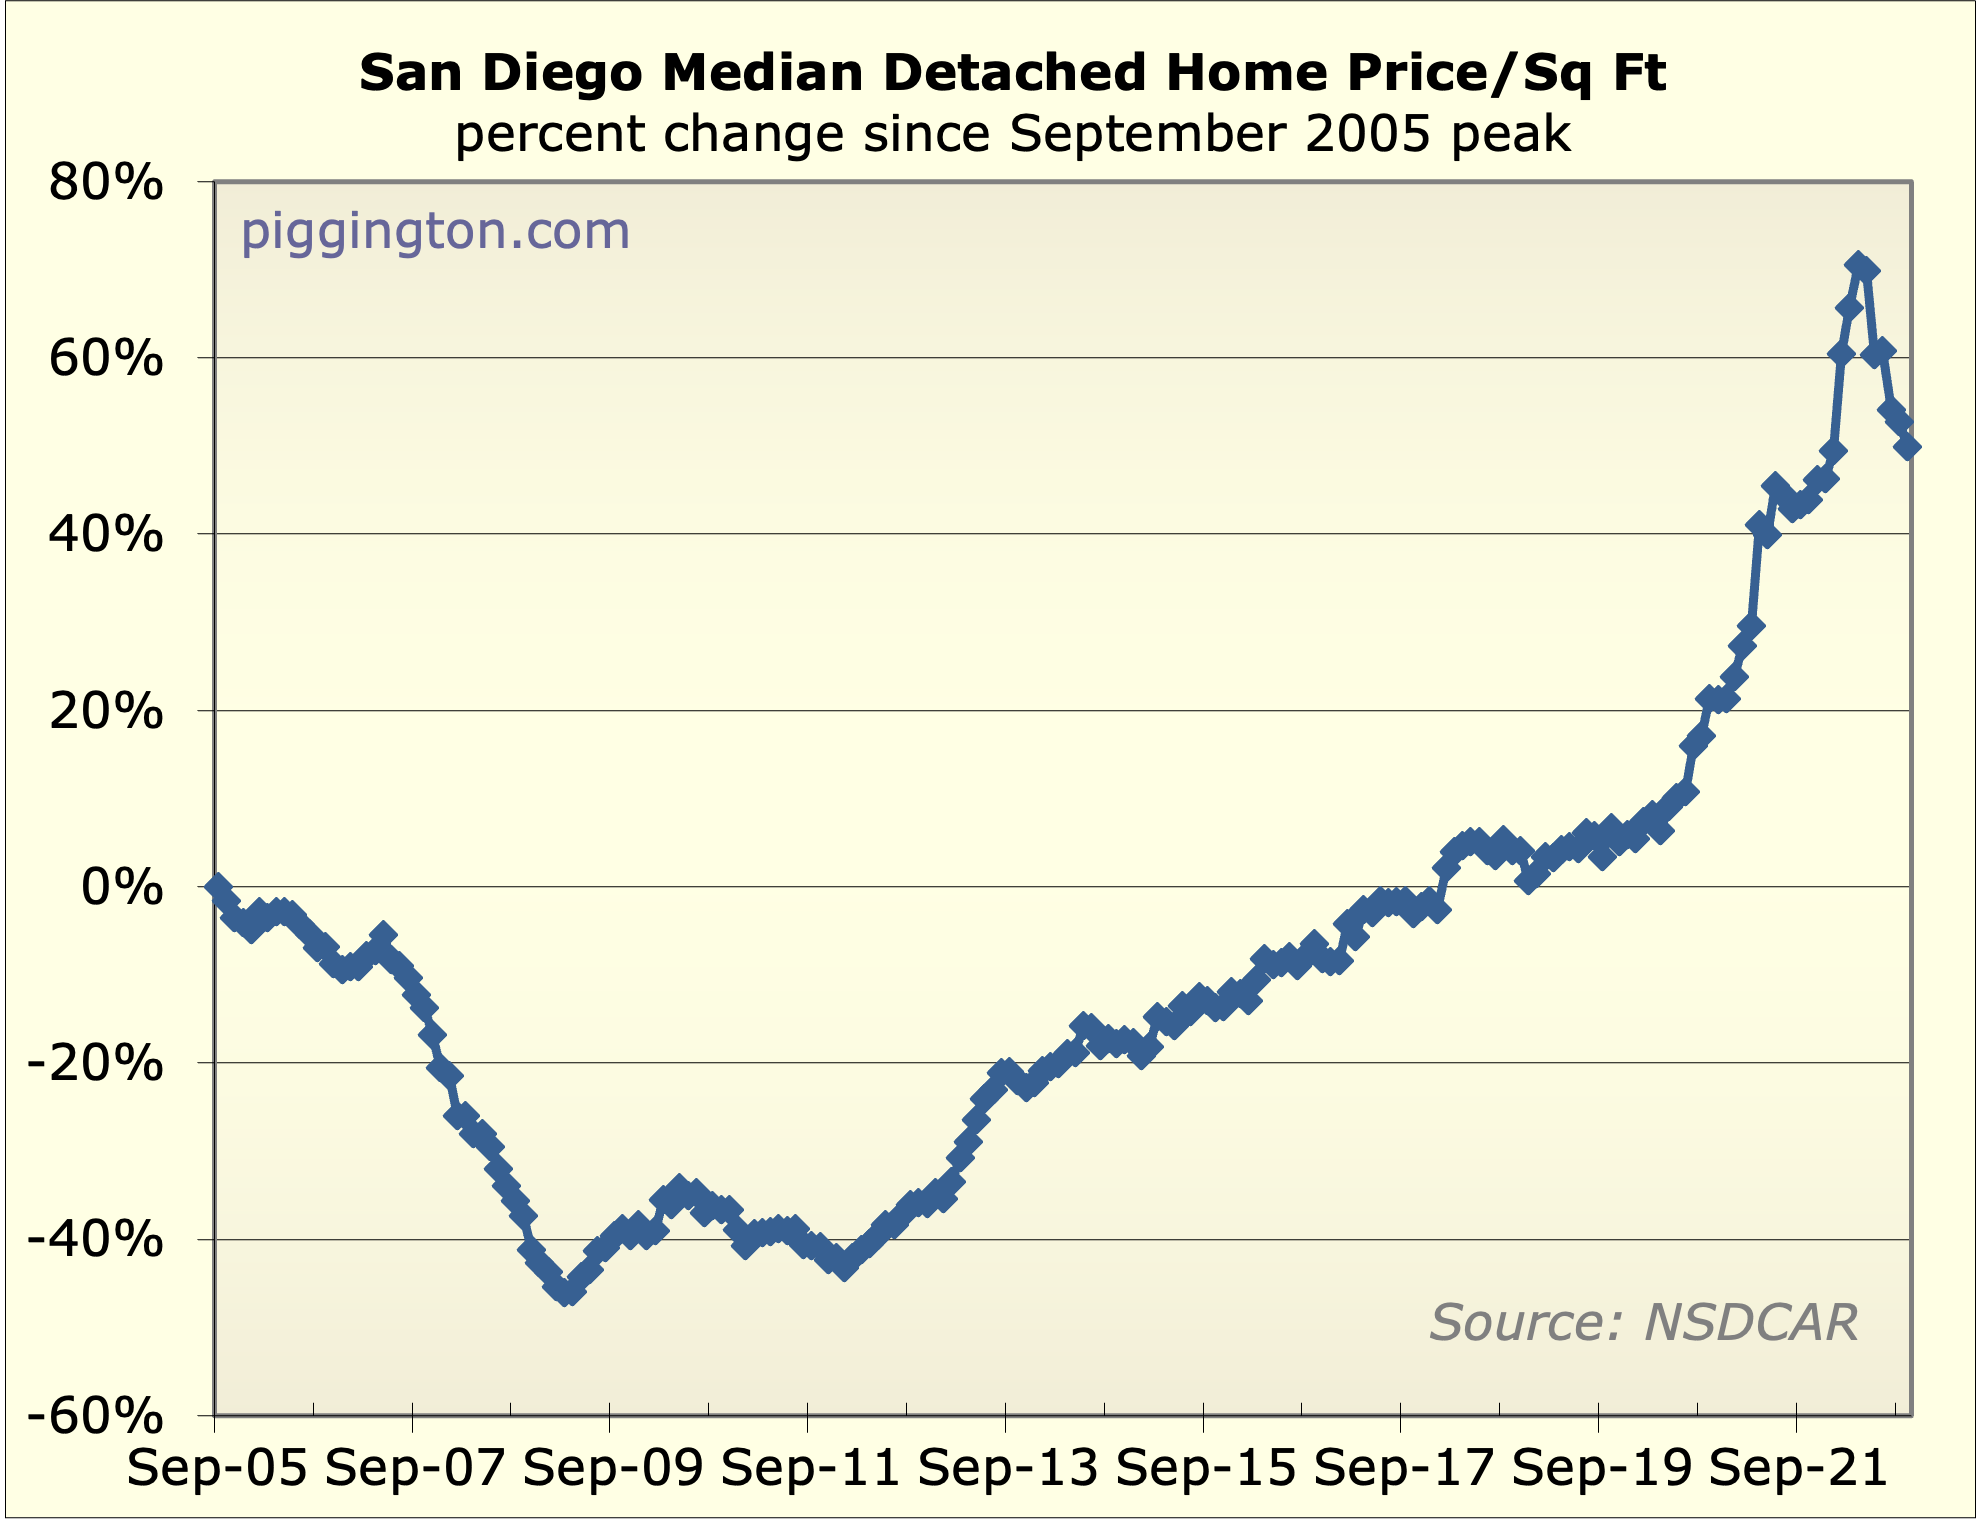
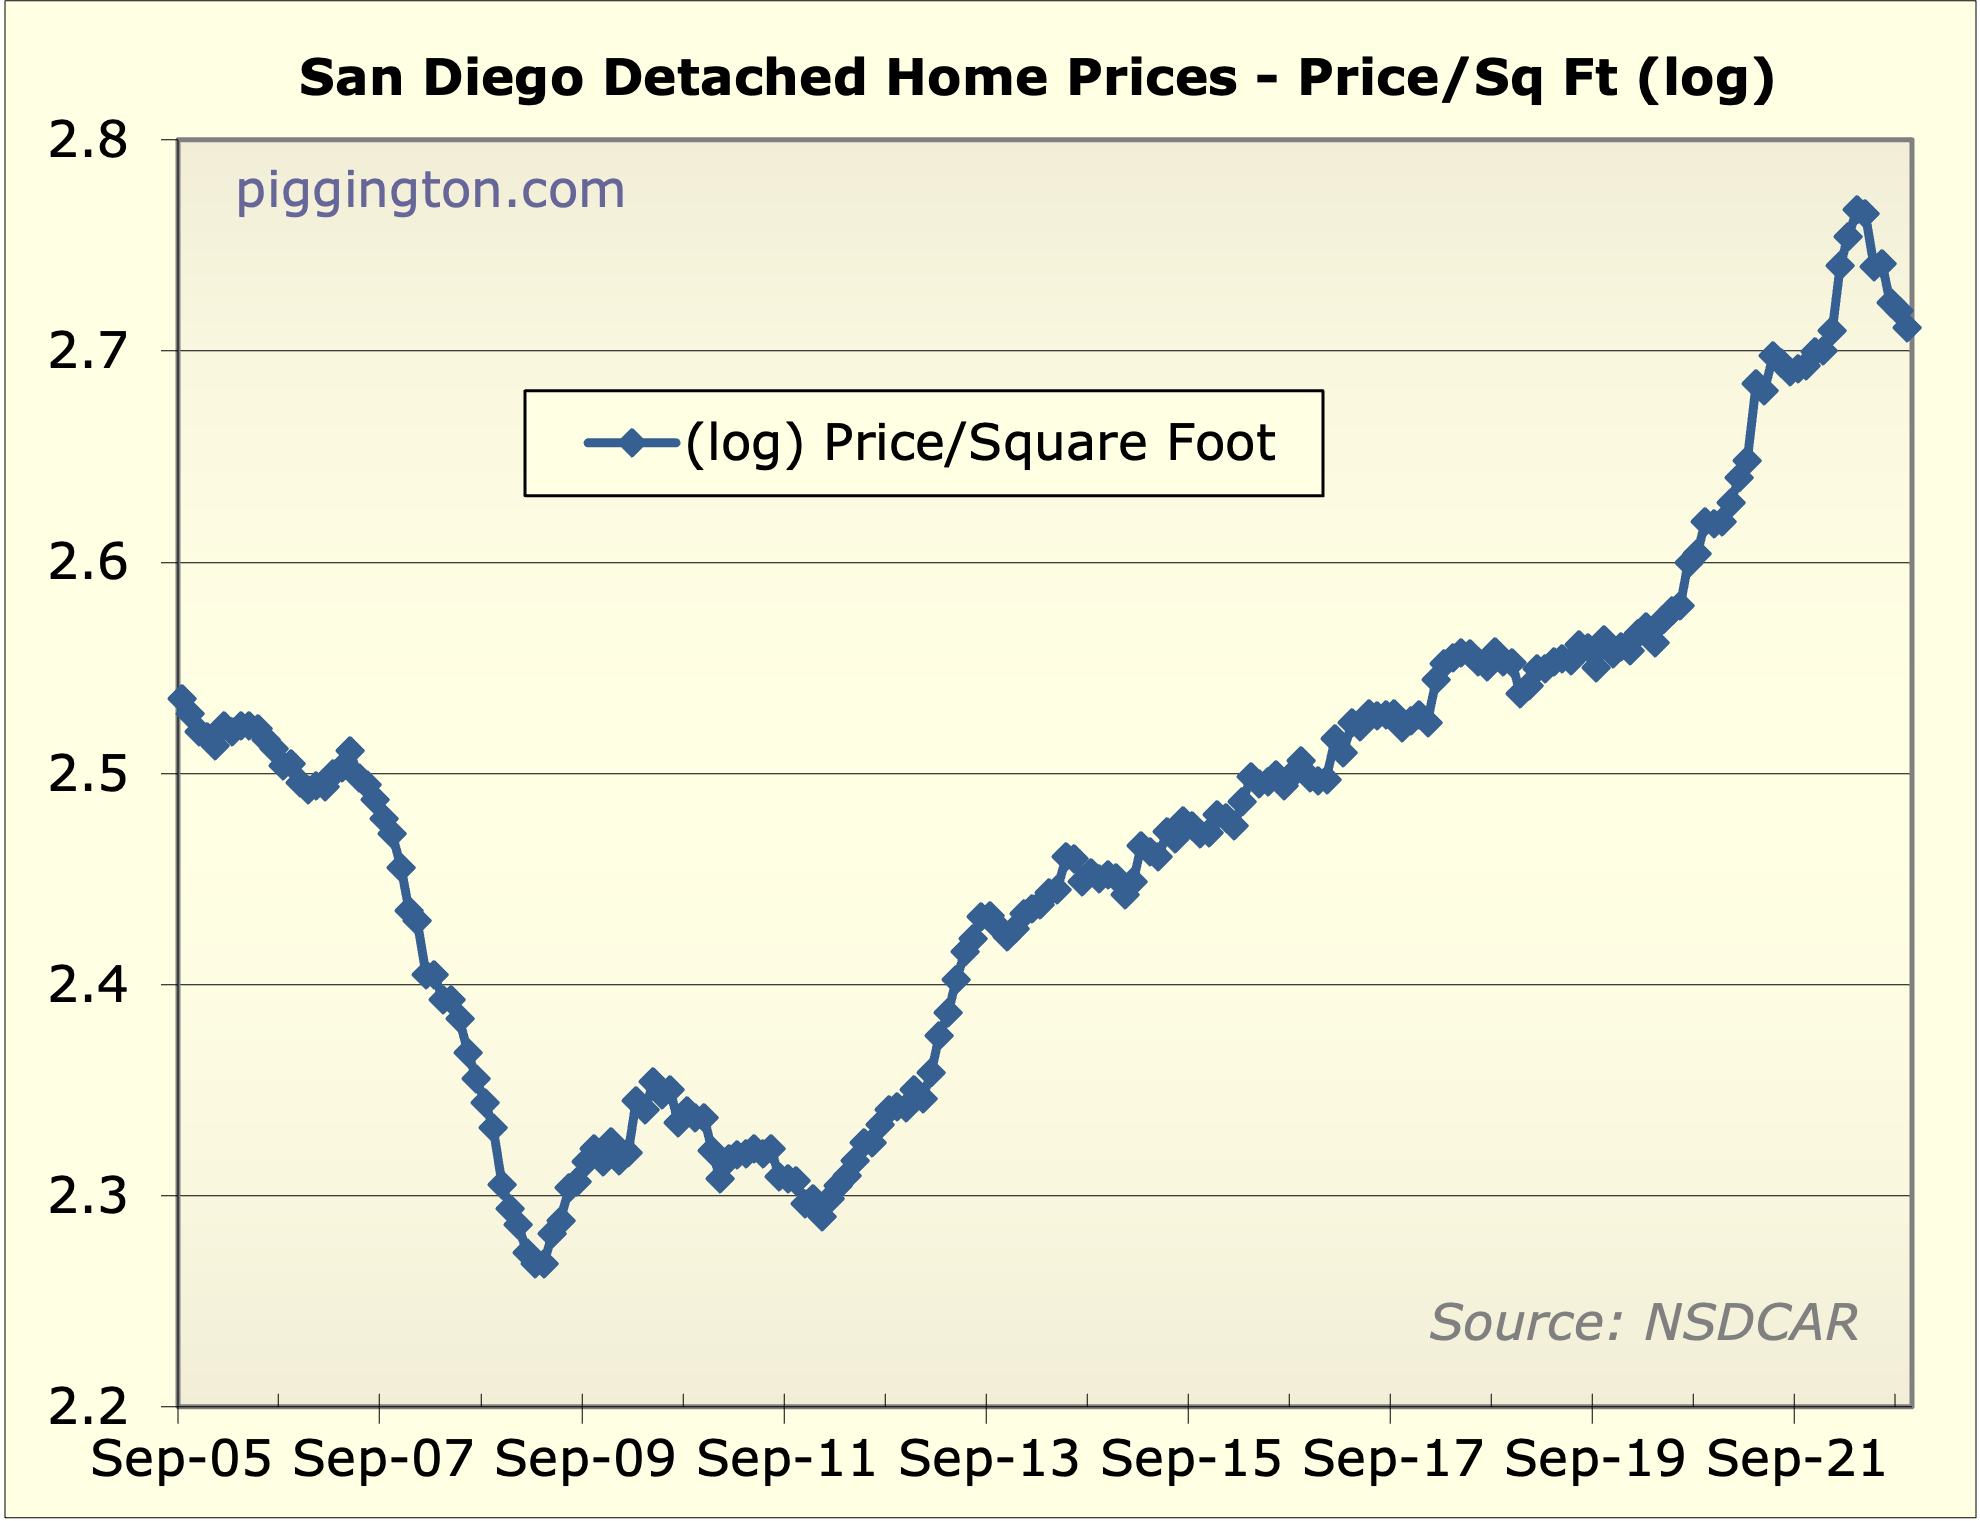
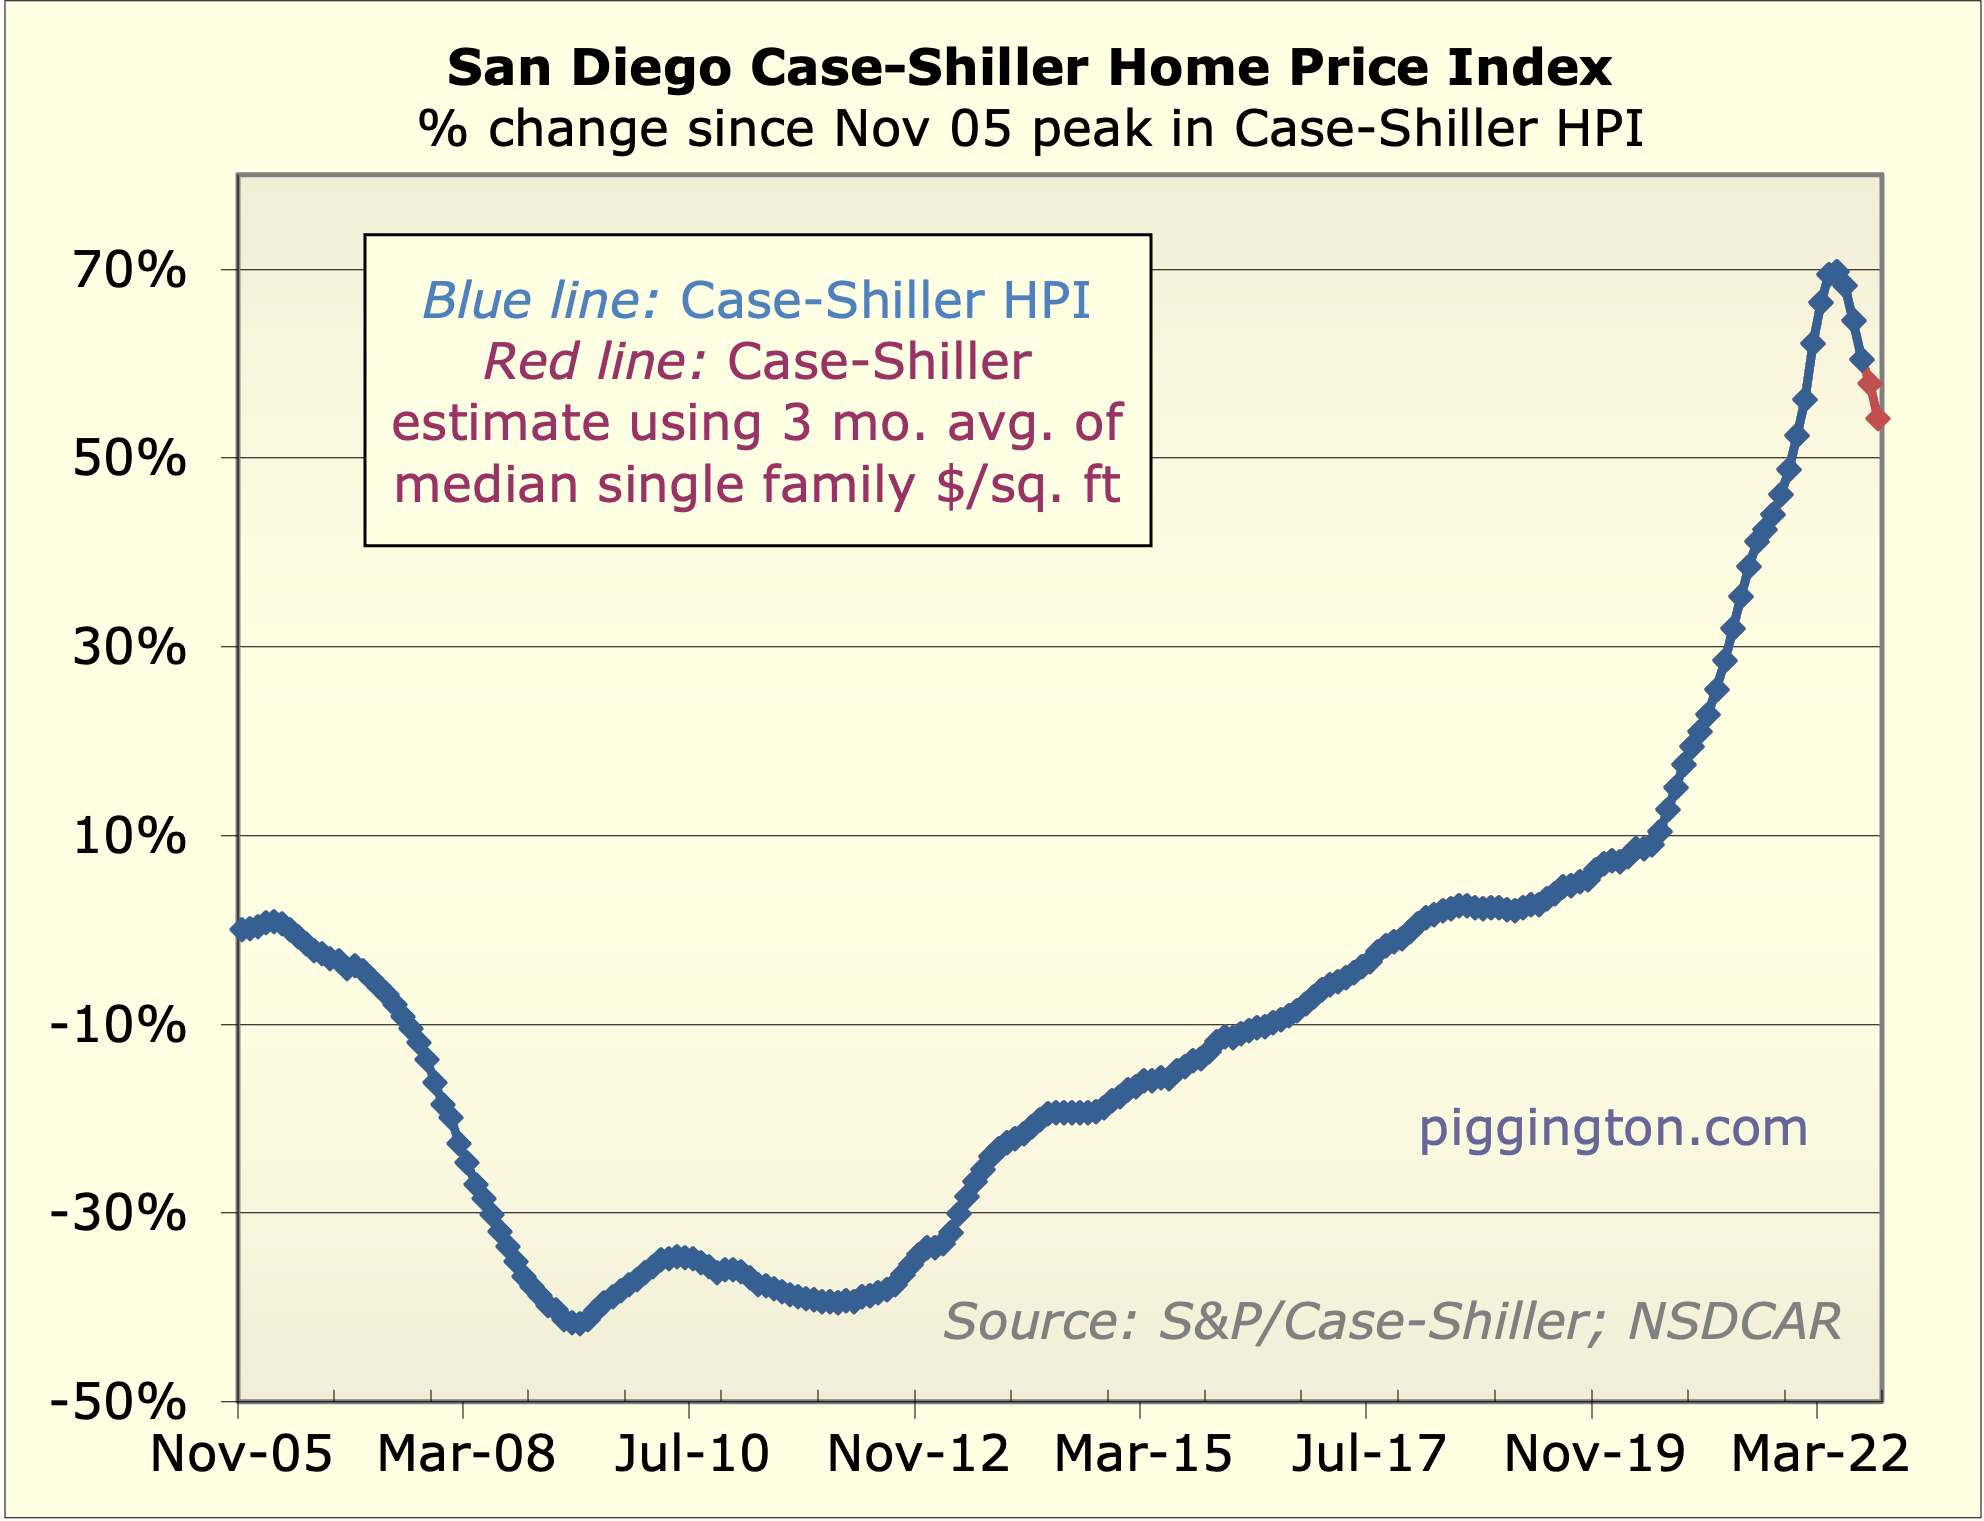
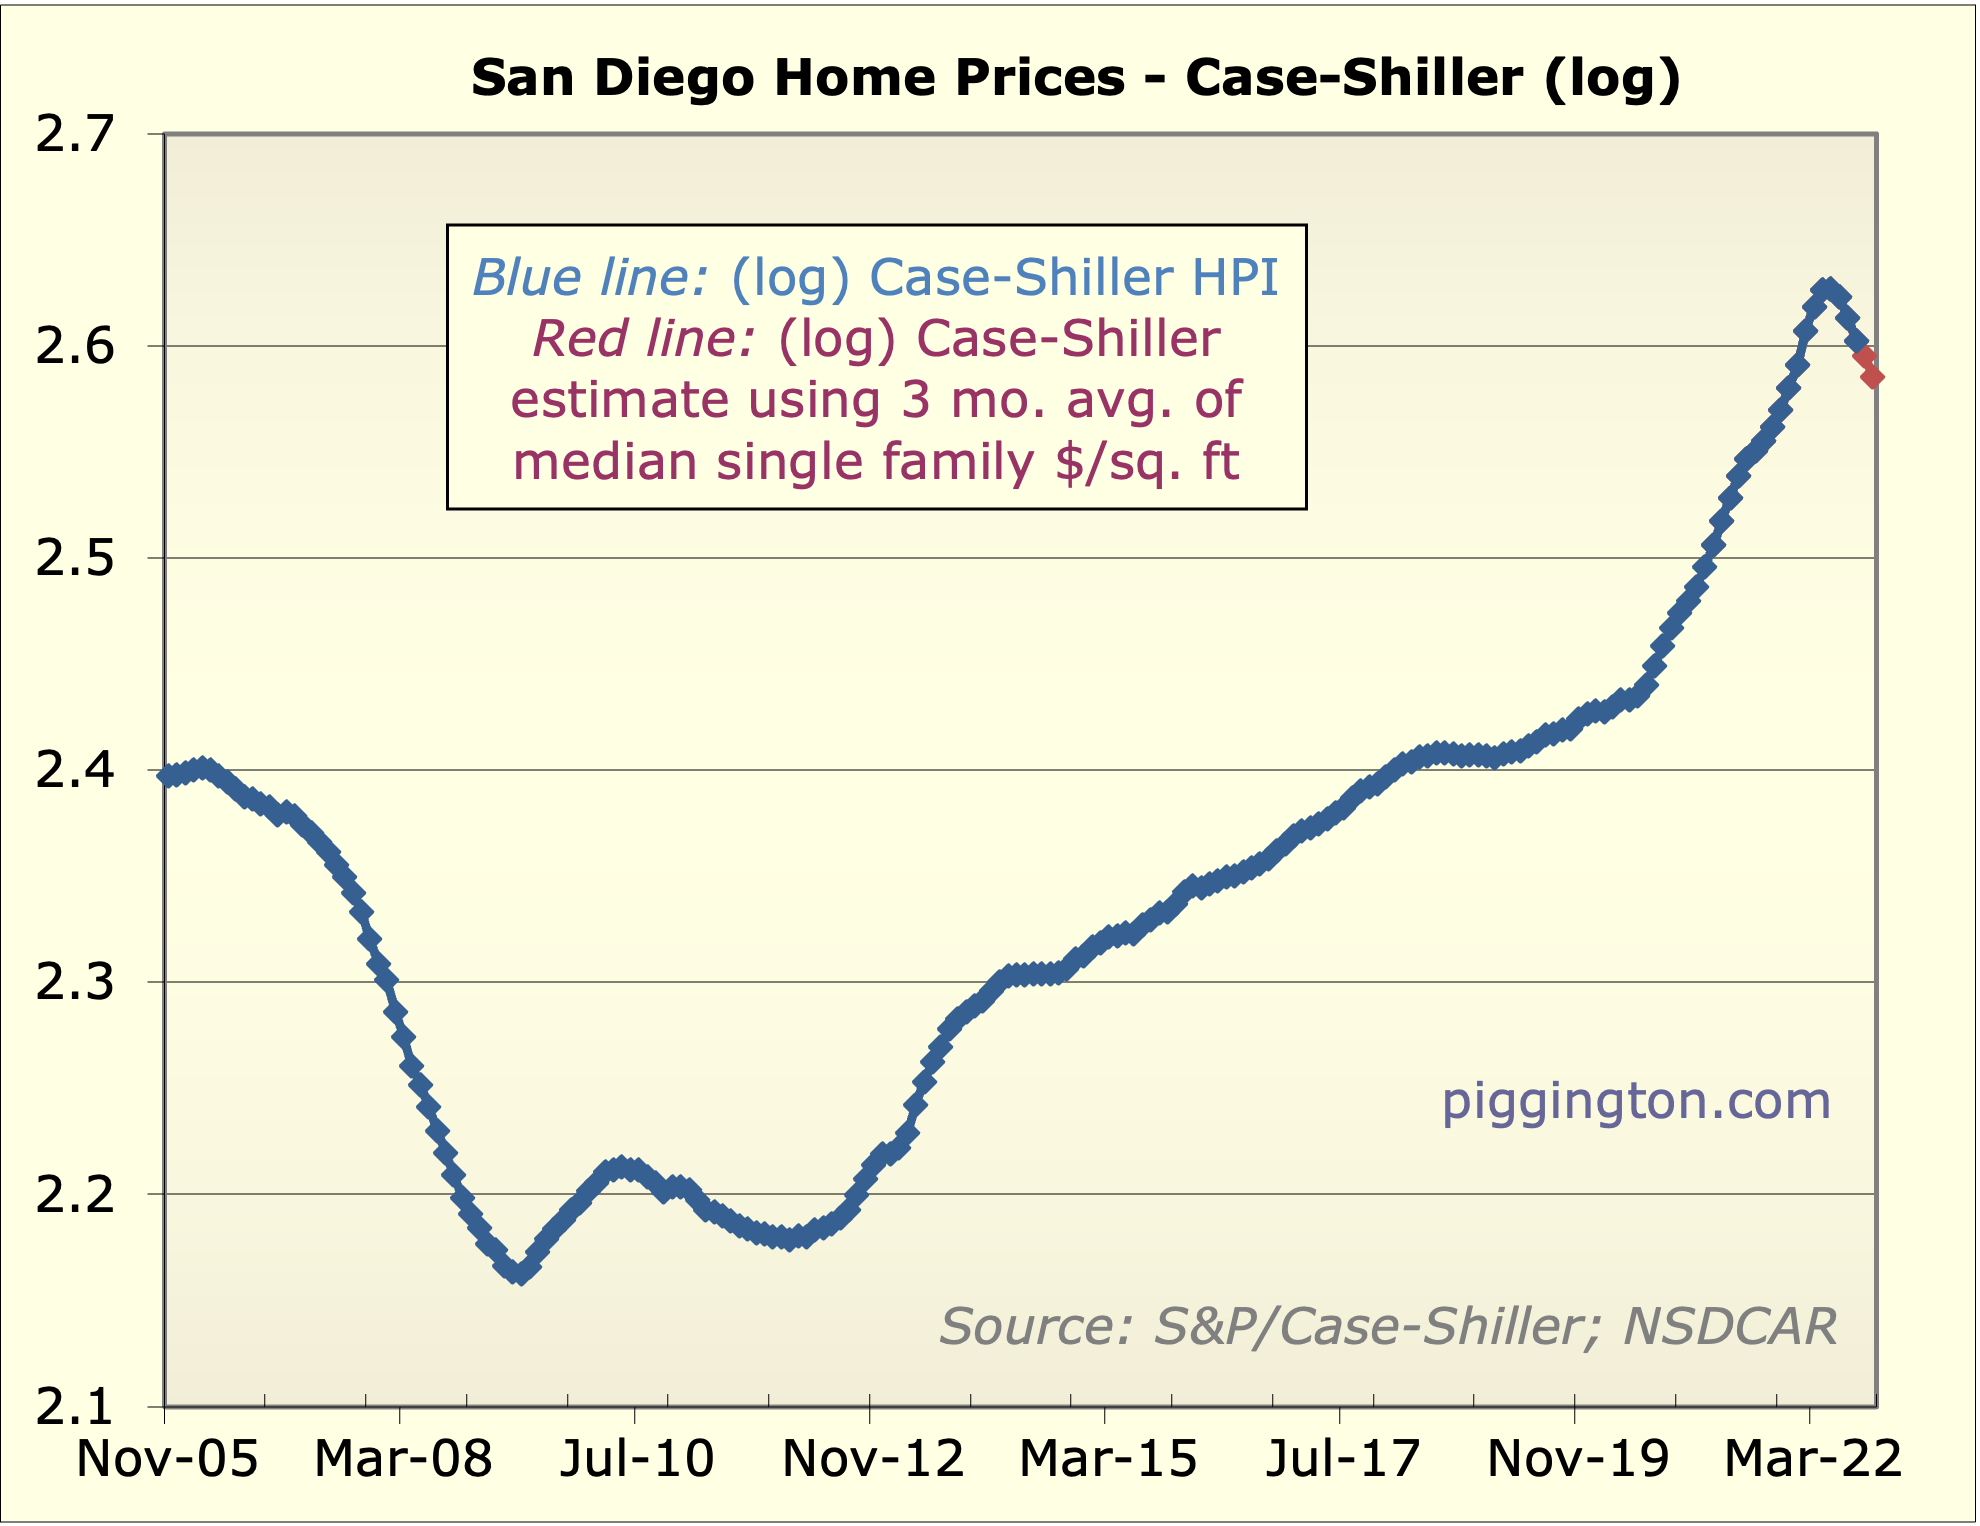
I guess that’s about it for this month. Prices took another notchdown; the single family price per square foot is down about 12% fromthe peak. That’s a noisy number, the smoother but laggierCase-Shiller (plus my recent estimate thereof based on smoothedpr/sqft) is down about 9% from the peak as of last month.
Random graphs below…
So this data is starting to
So this data is starting to catch up to what I’ve been reporting the last few months which is a precipitous drop in pending’s. However we are also saying a significant drop year over year in new listings. It’s easy to put extra emphasis on either of those depending upon what you’re hoping for. But the market is not reduced the black and white. The drop in new pending‘s while bigger than we’ve seen in the past happens to some extent this time of year every year. It won’t drop to zero and Spring always brings more demand. On the other side the drop in new listings while bigger than we have seen in the past happens to some extent this time of year as well. They won’t drop to zero either and spring will bring more inventory also.
We will be in a period of lower supply and demand. Prices should continue to drop but with a greater percentage of homeowners deciding not to sell that will mute the downside. The sellers strike doesn’t mean no one will sell but rather a lot less people will than normal. Things happen in the middle
Look at the inventory graph. This marks 3 years from the start of when it really began to drop. It has come back a bit but has leveled of late. It would have to increase 50% to get back to 2019 levels which were also far from excessive
sdrealtor wrote:The drop in
[quote=sdrealtor]The drop in new pending‘s while bigger than we’ve seen in the past happens to some extent this time of year every year.[/quote]
This observation piqued my interest so I counted dots on the chart and came up with the following:
2022: 1600
2021: 2800
2020: 3500
2019: 2800
2018: 2500
2017: 2700
2016: 2800
2015: 2700
2014: 2700
2013: 2700
2012: 2900
2011: 1900
2010: 2300
2009: 2600
Without exception, those points (counting back 12 months each time) were 2 months before the annual bottom we all know so well. I assume this series starts in November, so January 2023 could very well match the lowest we’ve seen since the financial world almost ended in 2007/8. If that doesn’t deserve notice, I don’t know what does.
The mortgage industry has been frantically laying off idled workers, so it doesn’t look like they think volumes will return soon:
https://www.forbes.com/sites/jonathanponciano/2022/11/07/housing-market-braces-for-rising-layoffs-soon-as-mortgage-lenders-home-sellers-cut-thousands-of-jobs/?sh=c3ba43f6933f
Yes volume is very very low.
Yes volume is very very low. It will continue to be low because of high rates, relatively low inventory and seasonality. High rates should be the biggest factor there.
Looking at the mortgage industry there is something far bigger at play. Historically well over 70% of mortgage originations have been for refinances the last several years. With so many of us sitting in record low rate mortgages that business aint coming back anytime soon even if sales volume miraculously surged. Unless rates drop back into the 3s i wouldn’t expect that to change
sdrealtor wrote:Historically
[quote=sdrealtor]Historically well over 70% of mortgage originations have been for refinances the last several years.[/quote]
The refi share didn’t go over 50% until Q2 2020, hitting a peak of ~68% in Q4, so if by “several” you mean “a couple” and by “well over” you mean “significantly less than” then OK. (Q4 2012 is the only quarter I can find that was over 70% in the last 10 years, per Statista).
Refi originations peaked at ~$900B in Q4 2020 and dropped linearly to ~$200B in Q2 2022.
It’s funny how our memories play tricks on us.
Interesting data:
Interesting data: https://www.financialsamurai.com/mortgages-by-interest-rate/
90%+ of mortgages in the US are below 5%. Based on historical mortgage rates, 90%+ of current mortgages refinanced over the past 13 years.
an wrote:Interesting data:
[quote=an]Interesting data: https://www.financialsamurai.com/mortgages-by-interest-rate/
90%+ of mortgages in the US are below 5%. Based on historical mortgage rates, 90%+ of current mortgages refinanced over the past 13 years.[/quote]
Interesting. Refinanced or bought more/other houses, yes. I recall the average lifespan of a mortgage as 8-ish years.
drboom wrote:an
[quote=drboom][quote=an]Interesting data: https://www.financialsamurai.com/mortgages-by-interest-rate/
90%+ of mortgages in the US are below 5%. Based on historical mortgage rates, 90%+ of current mortgages refinanced over the past 13 years.[/quote]
Interesting. Refinanced or bought more/other houses, yes. I recall the average lifespan of a mortgage as 8-ish years.[/quote]
That 8-ish years statistic is in a falling rate environment. We’re no longer in that environment. Not sure if it’ll be the same. Only time will tell.
I’m only 1 data point, but over the last decade, my loan average lifespan was ~1 year. Now that I’m locked in at 3.125%, unless rates drop below that, my loan’s average lifespan will probably be 30 years.
an wrote:
That 8-ish years
[quote=an]
That 8-ish years statistic is in a falling rate environment. We’re no longer in that environment. Not sure if it’ll be the same. Only time will tell.[/quote]
I picked up that statistic 20+ years ago, actually. No idea if it’s stale now.
[quote]I’m only 1 data point, but over the last decade, my loan average lifespan was ~1 year. Now that I’m locked in at 3.125%, unless rates drop below that, my loan’s average lifespan will probably be 30 years.[/quote]
Unless you’re getting hugely lower rates each time (which you can do once or maybe twice) or you always manage to do it with no closing costs, that’s not a great way to go–and even then, the amortization tables are working against you.
But you make a good point: I suspect a lot of repeat customers were in that re-fi boom.
drboom wrote:Unless you’re
[quote=drboom]Unless you’re getting hugely lower rates each time (which you can do once or maybe twice) or you always manage to do it with no closing costs, that’s not a great way to go–and even then, the amortization tables are working against you.
But you make a good point: I suspect a lot of repeat customers were in that re-fi boom.[/quote]
As they say, hind sight is 20/20, so with my 20/20 hind sight, I have to say, it worked out great for me. Always did no cost loans.
As for your point about repeat customers, I’m sure there are many, but bottom line is, 90%+ have mortgage under 5%.
an wrote:drboom wrote:an
[quote=an][quote=drboom][quote=an]Interesting data: https://www.financialsamurai.com/mortgages-by-interest-rate/
90%+ of mortgages in the US are below 5%. Based on historical mortgage rates, 90%+ of current mortgages refinanced over the past 13 years.[/quote]
Interesting. Refinanced or bought more/other houses, yes. I recall the average lifespan of a mortgage as 8-ish years.[/quote]
That 8-ish years statistic is in a falling rate environment. We’re no longer in that environment. Not sure if it’ll be the same. Only time will tell.
I’m only 1 data point, but over the last decade, my loan average lifespan was ~1 year. Now that I’m locked in at 3.125%, unless rates drop below that, my loan’s average lifespan will probably be 30 years.[/quote]
My average loan span was 3-4 years. This time the only thing that will prevent it from going 30 years are the additional principal payments i make to pay it off sooner than later. I’ll never see 2.625% again and even if i do the loan balance will be so low that it won’t be worth incurring the costs to refi it
drboom wrote:sdrealtor
[quote=drboom][quote=sdrealtor]Historically well over 70% of mortgage originations have been for refinances the last several years.[/quote]
The refi share didn’t go over 50% until Q2 2020, hitting a peak of ~68% in Q4, so if by “several” you mean “a couple” and by “well over” you mean “significantly less than” then OK. (Q4 2012 is the only quarter I can find that was over 70% in the last 10 years, per Statista).
Refi originations peaked at ~$900B in Q4 2020 and dropped linearly to ~$200B in Q2 2022.
It’s funny how our memories play tricks on us.[/quote]
I was thinking the last few years. To me several is 3-5. Sounds off but could be mistaken. You have a link for that?
Just the same it’s kinda irrelevant and pearl clutching. Whatever it’s been the refi business is gone for the most part for the foreseeable future and with it the mortgage industry
sdrealtor wrote:drboom
[quote=sdrealtor][quote=drboom][quote=sdrealtor]Historically well over 70% of mortgage originations have been for refinances the last several years.[/quote]
The refi share didn’t go over 50% until Q2 2020, hitting a peak of ~68% in Q4, so if by “several” you mean “a couple” and by “well over” you mean “significantly less than” then OK. (Q4 2012 is the only quarter I can find that was over 70% in the last 10 years, per Statista).
Refi originations peaked at ~$900B in Q4 2020 and dropped linearly to ~$200B in Q2 2022.
It’s funny how our memories play tricks on us.[/quote]
I was thinking the last few years. To me several is 3-5. Sounds off but could be mistaken. You have a link for that?[/quote]
I cited Statista, but plenty of other sources have the same data–I even backed into the numbers by category vs total volume from other sites.
[quote]Just the same it’s kinda irrelevant and pearl clutching. Whatever it’s been the refi business is gone for the most part for the foreseeable future and with it the mortgage industry[/quote]
Pearl clutching? You have the wrong metaphor–we’re not talking about moral issues or vulgarities.
Correct me if I’m wrong, but your thesis all around is that prices are sticky (in SD, at least) and that low for-sale volume will coincide with low demand to keep it that way?
drboom wrote:sdrealtor
[quote=drboom][quote=sdrealtor][quote=drboom][quote=sdrealtor]Historically well over 70% of mortgage originations have been for refinances the last several years.[/quote]
The refi share didn’t go over 50% until Q2 2020, hitting a peak of ~68% in Q4, so if by “several” you mean “a couple” and by “well over” you mean “significantly less than” then OK. (Q4 2012 is the only quarter I can find that was over 70% in the last 10 years, per Statista).
Refi originations peaked at ~$900B in Q4 2020 and dropped linearly to ~$200B in Q2 2022.
It’s funny how our memories play tricks on us.[/quote]
I was thinking the last few years. To me several is 3-5. Sounds off but could be mistaken. You have a link for that?[/quote]
I cited Statista, but plenty of other sources have the same data–I even backed into the numbers by category vs total volume from other sites.
[quote]Just the same it’s kinda irrelevant and pearl clutching. Whatever it’s been the refi business is gone for the most part for the foreseeable future and with it the mortgage industry[/quote]
Pearl clutching? You have the wrong metaphor–we’re not talking about moral issues or vulgarities.
Correct me if I’m wrong, but your thesis all around is that prices are sticky (in SD, at least) and that low for-sale volume will coincide with low demand to keep it that way?[/quote]
It’s not my thesis. Prices are sticky on the way down. My thesis is not that it will prevent price declines but rather keep them substantially less than they would be in the absence of happy homeowners with sub 3 and 4% mortgages that they’ll hold onto with their cold dying hands. Just like me
sdrealtor wrote:drboom
[quote=sdrealtor][quote=drboom]
Correct me if I’m wrong, but your thesis all around is that prices are sticky (in SD, at least) and that low for-sale volume will coincide with low demand to keep it that way?[/quote]
It’s not my thesis. Prices are sticky on the way down. My thesis is not that it will prevent price declines but rather keep them substantially less than they would be in the absence of happy homeowners with sub 3 and 4% mortgages that they’ll hold onto with their cold dying hands. Just like me[/quote]
Same here, yup: I’m putting this joint in a family trust along with the other two paid-for houses coming our way fairly soon. But not everyone is looking down the barrel of retirement.
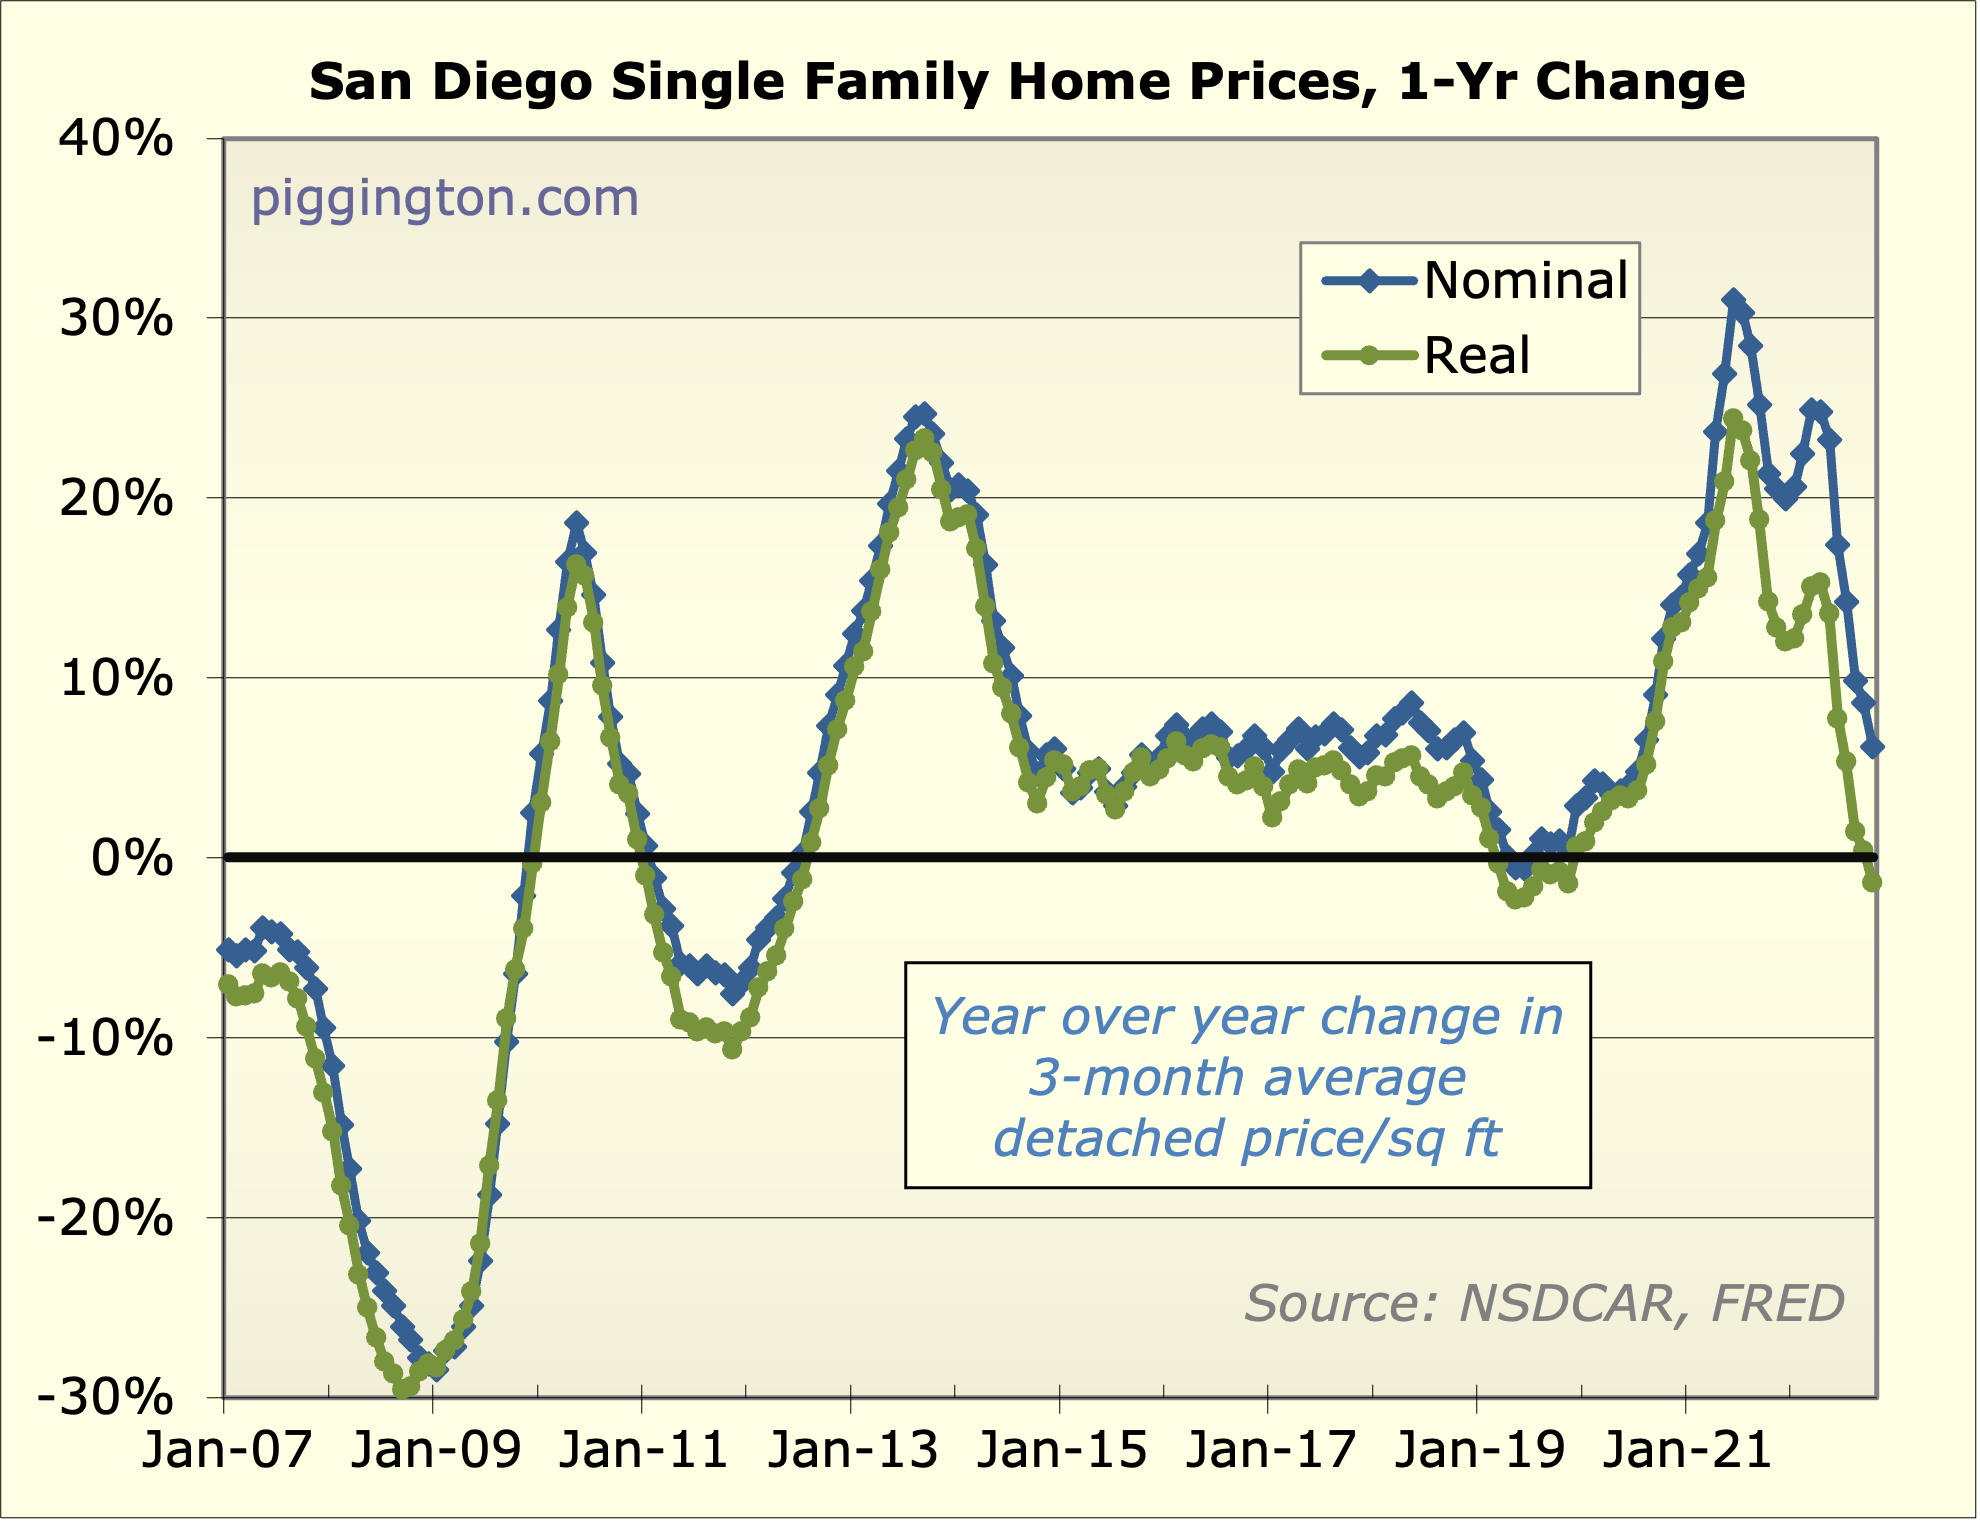
I’d say the historical charts disprove any ideas about stickiness: the curves look about the same on both sides and descend to about the same level; the differences only appear in the amplitude of the peaks.
Your thesis can’t be proved or even argued with, of course, unless you say ahead of time how far the market will fall and stipulate than anything under that disproves your theory. And we both know that’s a WAG.
My thesis is, in part, the opposite in two ways:
1) People always have to sell for one reason or another. Given that the market is payment-driven, declining prices will offset some of the increase from interest rates and keep buyers in the game.
2) Investors will distort the supply as much on the way down as they did on the way up, but possibly faster, which will result in sudden supply gluts.
Add in other factors resulting from insane post-2008 monetary policy, a trade or even shooting war with China, etc. and we’re in for a rough patch.
“If something can’t go on forever … it won’t!”
drboom wrote:My thesis is, in
[quote=drboom]My thesis is, in part, the opposite in two ways:
1) People always have to sell for one reason or another. Given that the market is payment-driven, declining prices will offset some of the increase from interest rates and keep buyers in the game.
2) Investors will distort the supply as much on the way down as they did on the way up, but possibly faster, which will result in sudden supply gluts.
Add in other factors resulting from insane post-2008 monetary policy, a trade or even shooting war with China, etc. and we’re in for a rough patch.
“If something can’t go on forever … it won’t!”[/quote]
Base on your thesis, how far will we fall and when will we see the bottom?
an wrote:
Base on your
[quote=an]
Base on your thesis, how far will we fall and when will we see the bottom?[/quote]
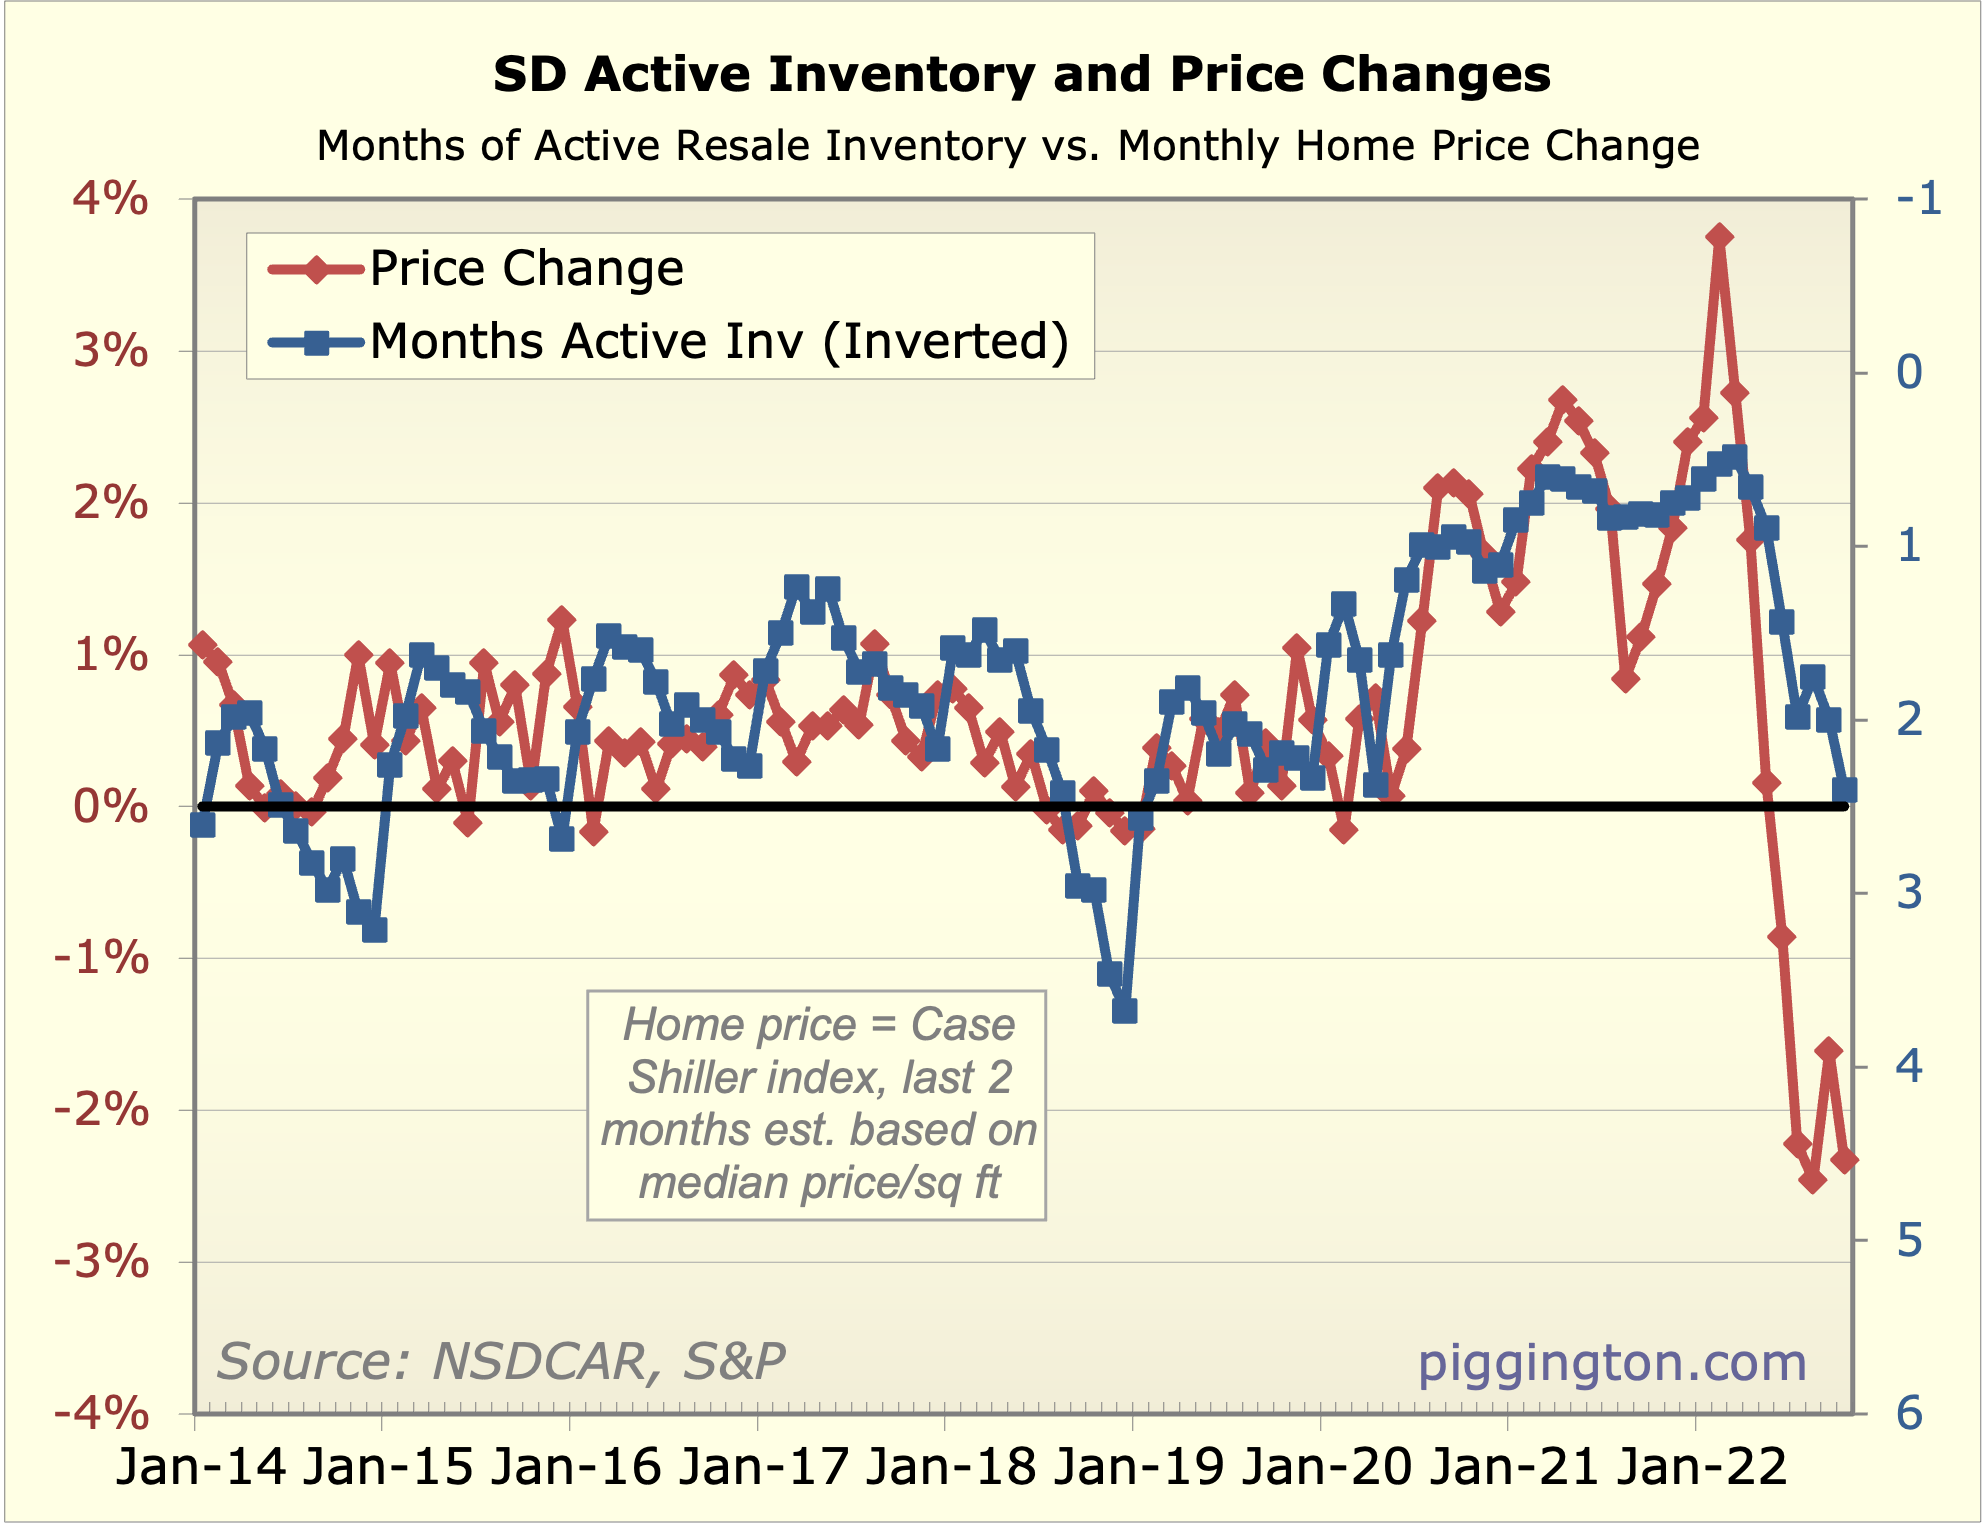
Just looking at the inflation-adjusted payment chart above, a return to the recent mean (not the low) would imply payments will drop by at least 25%.
If we assume the current payment mix reflects a 4% aggregate mortgage rate, we can figure out what proportion of the remaining 75% goes to principal for a given future interest rate. At 6.5%, that means the purchase price needs to drop by at least 40% in real terms to stay within the reduced payment limit.
Time frame? History suggests 2-3 years of definite contraction followed by a highly variable period that’s strongly affected by government intervention etc.
Coming to you from Dr B’s
Coming to you from Dr B’s ivory tower!
sdrealtor wrote:Coming to you
[quote=sdrealtor]Coming to you from Dr B’s ivory tower![/quote]
With commentary from Captain Anecdote, apparently. 😀
drboom wrote:sdrealtor
[quote=drboom][quote=sdrealtor]Coming to you from Dr B’s ivory tower![/quote]
With commentary from Captain Anecdote, apparently. :-D[/quote]
I <3 this
drboom wrote:Just looking at
[quote=drboom]Just looking at the inflation-adjusted payment chart above, a return to the recent mean (not the low) would imply payments will drop by at least 25%.
If we assume the current payment mix reflects a 4% aggregate mortgage rate, we can figure out what proportion of the remaining 75% goes to principal for a given future interest rate. At 6.5%, that means the purchase price needs to drop by at least 40% in real terms to stay within the reduced payment limit.
Time frame? History suggests 2-3 years of definite contraction followed by a highly variable period that’s strongly affected by government intervention etc.[/quote]
Cool, I hope you’re right. 2-3 years will come and go in no time.
lol your reading the charts
lol your reading the charts wrong. Prices typically go up quickly then slow down and hit a peak. They aren’t sticky as they start going up but rather surge at beginning of cycle. Then on the downside the stickiness comes at the beginning of the cycle where they go down slowly initially. That’s what you are seeing in those historical graphs, downside stickiness followed by faster drops. Of course this time was different and they went down fast due to unprecedented rate increases. You just needed a better understanding of what you were looking at
Here you go Dr B you’re gonna
Here you go Dr B you’re gonna love this one
https://www.housingwire.com/articles/last-night-my-uber-driver-was-a-loan-officer/?utm_campaign=Newsletter%20-%20HousingWire%20Daily&utm_medium=email&_hsmi=233279575&_hsenc=p2ANqtz–t98Qw48BA_H4I80Qu1xLTzHOTQ-I_aDJWmcr-5S2CuVvAKqqy_8JeKT5LpfnWp1LNRBZPR4BEpqRXrG3-8sDuTHHJMg&utm_content=233279575&utm_source=hs_email
We’re reading the same charts
We’re reading the same charts and I think we’re understanding them just fine like the last time we went through this exercise. Prices weren’t sticky going down after the last bubble and they aren’t being sticky with this one, either. That story is even clearer than it was back in June when the market here turned as expected.
Interest rates are going to keep going up until the labor market turns, which hasn’t even budged yet. We’re going to hit the peak selling market next year with the affordability index at record setting levels. Spring is going to be a blood bath in my opinion. For now, we watch and wait.
You do know rates dropped
You do know rates dropped about 0.6% today?
The prices that arent sticky are typically distressed sales. Those have not been part of this equation so far and its unkown if they will be. The big drop we just experienced was due to prices those of us in the business knew were never real and would revert back once the rate environment changed. Ive been saying that here since Early Spring many many times. We now are back to around where we were a year ago. This is where the stickiness will begin.
For now we watch and wait. Id wager Spring wont be a blood bath. It wont be boom times again but it will be a slow slightly tough market. The next leg down should start as Spring winds down early next Summer and should not be as severe as what we just saw.
sdrealtor wrote:You do know
[quote=sdrealtor]You do know rates dropped about 0.6% today?
The prices that arent sticky are typically distressed sales. Those have not been part of this equation so far and its unkown if they will be. The big drop we just experienced was due to prices those of us in the business knew were never real and would revert back once the rate environment changed. Ive been saying that here since Early Spring many many times. We now are back to around where we were a year ago. This is where the stickiness will begin.
For now we watch and wait. Id wager Spring wont be a blood bath. It wont be boom times again but it will be a slow slightly tough market. The next leg down should start as Spring winds down early next Summer and should not be as severe as what we just saw.[/quote]
Ease up on the condescension, would you please? It’s getting aggravating.
Anyhow, I said “straight off a cliff” at some point back in spring/summer and that’s exactly what’s been happening. The charts above show that. I’ve made my call. I understand your opinion and disagree with it, that’s all. We won’t know until spring who’s more right.
Sellers strike: We thought
[img_assist|nid=27755|title=Sellers strike|desc=We thought last year inventory was low. Demand is even more anemic than these numbers but this will help limit the down side|link=node|align=left|width=97|height=100]
Seller strike affects buyers
Seller strike affects buyers the most IMHO, especially if you have a specific floor plan in the specific area you want to buy. If no one is selling (it can easily happen in older areas), then you’re SOL. If you buy an investment property, it doesn’t matter as much, but if you’re trying to buy a home, good luck.
an wrote:Seller strike
[quote=an]Seller strike affects buyers the most IMHO, especially if you have a specific floor plan in the specific area you want to buy. If no one is selling (it can easily happen in older areas), then you’re SOL. If you buy an investment property, it doesn’t matter as much, but if you’re trying to buy a home, good luck.[/quote]
The one story in my neighborhood and the neighborhood next to me hasn’t been on the market in almost four years. The other neighborhood next to me even longer. My next door neighbor will never move. Her parents are in their home at least 40 years a couple miles away in theirs
Here’s a crazy data point. I sold a one story in the 3rd neighborhood near me during the pandemic for a then record price. The next one sold just over a year later for 60% more. It was much nicer (not a rental) and on premium lot but still. Six months later it would have gone almost double what mine sold for but today it’s back at the price it sold about a year ago
Important data point: Redfin
Important data point: Redfin (via ZeroHedge) reports that, in Q3 ’22, investor purchases of homes in San Diego fell 35% year-over-year and constitute 21% of home sales in San Diego (nationwide, SFRs constitute 73% of investor home purchases, with the rest split amongst condos, townhomes, and apartments).
https://www.redfin.com/news/investor-home-purchases-q3-2022/
DrBoom and JPJones, your read of the data and outlooks for price movements — down, down, down — make great sense to me.
Interesting times!
So they are falling in line
So they are falling in line perhaps less than owner occupants.
Another month, another drop
Another month, another drop in Case-Shiller prices for San Diego:
https://fred.stlouisfed.org/series/SDXRSA
https://www.sandiegouniontribune.com/business/story/2022-11-29/san-diego-home-price
John S. wrote:Another month,
[quote=John S.]Another month, another drop in Case-Shiller prices for San Diego:
https://fred.stlouisfed.org/series/SDXRSA
https://www.sandiegouniontribune.com/business/story/2022-11-29/san-diego-home-price%5B/quote%5D
Ho hum!!! That index is for September which includes properties that mostly went into escrow in July and August. None of this is news and is still well behind the current reality I’ve been writing about for a few months. We are off 15-20% from the Spring peak numbers. The only thing left is for the Johnny come lately data reporters to actually post about that. Of course by then they will be 3 months behind the then current reality
30 year fixed rates are now
30 year fixed rates are now 0.72% below their peak: 7.37% on 10/20 versus 6.65% on 11/29.
Another big rate drop today,
Another big rate drop today, making the 30-year 1.08% below the October peak.