Forum Replies Created
-
AuthorPosts
-
 Rich ToscanoKeymaster
[quote=ltsdd]
Hindsight is always 20/20. How many folks knew or realized that the “economic collapse” had passed while it was happening? It’s a big economy that they tried to right, the bigger the ship the slower the turn.[/quote]https://research.stlouisfed.org/fred2/series/USSLIND
(for example)There were ongoing concerns about the strength of economic growth, but the “emergency” monetary policy continued for many years after the emergency was over (based on real-time indicators).
Rich ToscanoKeymasterAgreed, there are many drivers, but my argument is that the Fed exacerbated it by targeting higher asset prices, which disproportionately benefits the rich. (And they did target higher asset prices as a direct goal of their policy; they’ve said as much themselves).
Rich ToscanoKeymasterHarvey, I’m not talking about during the crisis, I’m talking about after the crisis. The easy money continued for Bernanke’s entire tenure, years after the risk of “economic collapse” had passed. That’s the period I’m talking about.
Rich ToscanoKeymaster[quote=scaredyclassic]his beard is well groomed.[/quote]
It is. And to be clear, I think he is probably a good guy who has/had the best of intentions. I just think he and most of the Fed have a blind spot to their own role in the boom/bust cycle, and that very bad things have come of that blind spot (and will yet again).
Rich ToscanoKeymasterAND ANOTHER THING. (While I am apparently ranting). I am mystified as to why left-leaning/progressive folks seem to be the loudest of Bernanke’s cheerleaders.
All things equal, high asset prices enrich the “haves” and do nothing to benefit the “have nots,” thus widening the wealth gap.
Bernanke’s policies appeared to have a minimal impact on real economic growth (once the liquidity crisis was past), but they resulted in an EPIC boom in US financial asset valuations. Thus, almost definitively, it seems to me, widening the gap between the haves and have nots. (And, on a relative purchasing power basis, benefiting the rich at the expense of the poor).
Yet the people who are most concerned with the plight of the have-nots seem to generally LOVE Bernanke. I just don’t get it.
Rich ToscanoKeymaster[quote=ltsdd]Wouldn’t buy the books.
Bernanke doesn’t get enough credit for preventing a more serious economic meltdown.
Greenspan doesn’t get enough blame for the mess he “dumped” on Bernanke.
…as for Yellen, I am not exactly sure what she’s been doing.[/quote]
Bernanke gets plenty of credit for preventing a meltdown… that’s practically all I ever hear about him.
I don’t agree that he just passively had a mess “dumped” on him. He was with the Fed for a long time and was a major proponent of easy-money policy in the early 2000s. After he took over as Chairman (which was shortly before the bubble peaked), he repeatedly denied that there was a housing bubble, saying that home prices simply reflected positive economic fundamentals.
Thus, he was complicit in the last bubble. Then he went on to play a major role in stoking the next round of the bubble-and-bust, or at least “really overpriced assets-then-bust,” cycle. I’ll admit that the second statement is my opinion and the outcome remains to be seen. However, I think the state of asset valuations in the US is strongly supportive of it.
We’ll see, I guess. In the meantime, I find all the Bernanke hero-worship — which completely ignores the seemingly obvious role of the Fed in helping create these huge booms and busts — to be quite grating.
Rich ToscanoKeymasterYeah, the dept of numbers thing looks like it’s using real rents, whereas Case Shiller is nominal, so you can’t compare them. For rents I use the BLS numbers, which you can find for SD by poking around here:
(I use rent of primary residence). This isn’t completely up to date so I use Zillow stats to fill in the blank for the most recent period. But I use CPI rent as the main thing.
Rich ToscanoKeymaster[quote=no_such_reality]I just realized your chart is price versus equally waited rent/income. Rent seems just as crazy as housing, how’s the chart look versus just income?
I agree today is much more rational than 2006, just with the incredibly low interest rates, I’d expect a higher multiple for lower income.[/quote]
It’s about the same. That’s why I started combining them, they were basically saying the same thing…
Rich ToscanoKeymasterI find it ironic that this topic is currently appearing next to “Getting that 2006 feeling again” in the active topics list. That is a thread about what appears (in my view) to be a pretty widespread bubble in Silicon Valley.
This article pretty much sums up my view: http://blogs.reuters.com/breakingviews/2015/10/15/chancellor-bernankes-courage-hides-bigger-error/
The shorter version is:
1. Too-easy Fed policy leads to bubbles
2. Bubbles burst
3. The Fed responds by easing monetary policy
4. Goto 1Sometime after step 3 but before step 2, the Fed chairman should be hailed as courageous genius and he should write a self-aggrandizing, douchily titled memoir.
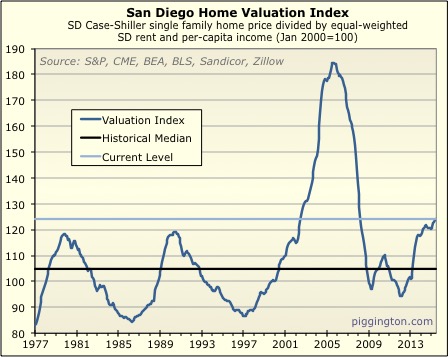
Rich ToscanoKeymasterAs I’ve grown fond of pointing out, the current situation in San Diego bears little resemblance to 2006:
However, I don’t know that the same can be said for Silicon Valley and its environs. A lot of the stuff going on up there seems blatantly unsustainable, and not just the housing market.
It seems to me that an awful lot of what’s going on in SV resembles a bubble, or at least (if a less controversial term is desired), is economically unsustainable. What’s going on in the venture capital space seems particularly wacky. Hell, there are not one, but TWO tv comedies about trying to get venture funding in/near SV! (Silicon Valley, which btw is comic genius, and Betas).
Of course that’s just anecdotal, but there is an awful lot of bubble-like behavior taking place as far as I can tell. I read an article recently about some startup shooting money onto the street at some conference. The shockingly high price of housing in the area also fits into the bubble narrative quite well.
I wouldn’t be surprised to see a serious retrenchment in many aspects of the SV economy in the years ahead.
Rich ToscanoKeymaster[quote=moneymaker]Nice chart Rich, in 1986 interest rates were very high, in 1997 there were massive layoffs from government contractors, the 2006 bubble was from fog loans, 2009 and 2012 could be called dead cat bounces, current highs are due to low interest rates. How easy it seems to explain stuff with hind sight. I think the recent dip could be because of Qualcomm or the fear of rates going up.[/quote]
Except, some of those explanations don’t make sense. Rates were high in 1986, but they were a LOT higher in, say, 1982. The govt contractor layoffs you refer to happened in the early 1990s, not in 1997.
It’s harder than it seems to explain why valuations do what they do. All you can really know, in my view, is that if they are high they will probably eventually go lower, and if they’re low they will probably go higher… other than that, who knows.
Rich ToscanoKeymasterBTW here’s an easy visual on this… homes were cheap (compared to rents and incomes) in the mid 90s, but are about as overpriced now as they were underpriced back then.
So, in fairness, roughly half of the 56% outpacing of home prices since 1995 is attributable to home prices catching up with incomes, since they started out quite underpriced.
But it’s just plain wrong to say that incomes have kept up with home prices since the mid-90s.
Rich ToscanoKeymasterIf she is trying to justify overall regional house prices we need to look at overall salaries, not just senior software engineer salaries.
You said mid-90s, so I will use 1995. Since 1995:
124% increase in SD per capita income
194% increase in SD home pricesSo your friend is right that home prices have tripled since the mid-1990s, but wrong that salaries have kept pace. Home prices have increased 56% more than incomes over that period.
This is specific to SD but I doubt that it’s much different for SoCal as a whole.
Rich ToscanoKeymasterI’m not seeing a drop on there? Per the Redfin chart to the lower right, which is a good measure (3 month avg of pr/sqft) it looks like closing prices have risen steadily, though list prices have flattened out a bit. In any case I would expect price weakness going into the end of the year, I don’t think it’s meaningful (if indeed there is price weakness, which so far I haven’t seen).
-
AuthorPosts