Over at VoiceofSanDiego.org, I just put up a piece on the January 2008 sales-per-default data. Conclusion: if potential must-sell housing supply was overwhelming demand back in the protracted downturn of the 1990s, it is now 3.5 times as overwhelming.
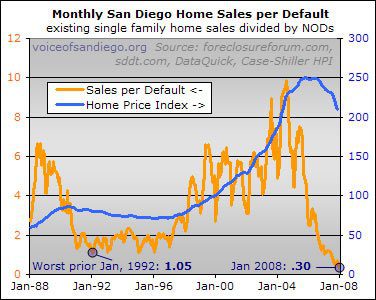
Up until now, my basic read on this chart was binary: historically, if single family sales-per-NOD were below about 2, prices were declining, and if they were above 2 prices were rising. Needless to say, sales-per-NOD at .3 means the housing market is deep in downward pressure territory. (Remember that we are comparing NODs on all properties to just single family home sales, because the latter was the only long-term sales volume series I could find — my thanks go out to the reader who supplied me with the historical sales information).
However, user gdcox (a Brit who, in addition to being an actual real-life economist, occasionally supplies we Colonial Piggs with insights on the UK housing bubble) suggested that I try to quantify the specific degree of price pressure caused by changes in the sales-per-default ratio. I think that’s a great idea and it’s something I’m going to be looking into in the weeks ahead.
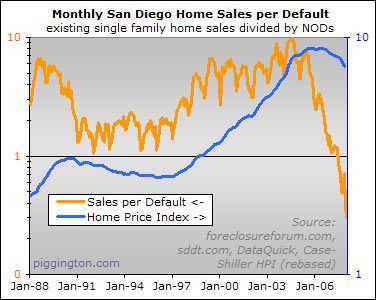
In any case, I had a few more foreclosure graphs to share. First, here is a version of the above graph using a logarithmic scale to show precisely how eh-screwed the San Diego housing market is in comparison to the 1990s (thanks to sdduuuude for haranguing me into doing a log chart):
Next up, an update on the number of NODs becoming NOTs:
Now, this is an extremely rough graph, because I am simply taking NOTs in a given month as a percent of NODs 3 months prior (because 3 months is the standard minimum time between NOD and NOT). However, as a great piece of investigative reporting by ocrenter shows, a lot of NODs are taking a heckuva lot longer than 3 months to work their way through to the next stage in the process.
Despite that fact, the ratio of NOTs to 3-months-prior NODs was most recently at 66% — higher than anything seen in the 1990s bust.
Of course, this wouldn’t be a proper extravaganza without trotting out the recent chart of NODs and NOTs as a percentage of San Diego labor force (original writeup here):
Finally, user radelow asked for a close-up on the above chart to get a better idea of recent monthly changes. I decided to start the chart at the beginning of 2005, which as you can see above was pretty near the lows but not long after they had started rising. Just for kicks, I am using the raw number of NODs and NOTs instead of adjusting them for labor force growth, because the population changes don’t exert a noteworthy impact over the shorter term.
There appears to be a serious onslaught of must-sell inventory coming down the pike, friends. One thing that’s worth noting, though: like most of the charts I constantly assail you with, these figures represent San Diego county in aggregate. There are in fact huge regional differences in where these foreclosures are showing up. So far, most of them are still from subprime loans and thus showing up in the lower-cost submarkets. I do think we will see more trouble in the higher end markets from three potential sources:
- Non-subprime mortgage timebombs. The subprime loans tended to have shorter reset periods, but there were plenty of no-doc, negatively amortizing loans written to people with good credit (i.e., people living in the more expensive areas). The evidence suggests that reset-driven foreclosures resulting from these loans are still in the future.
- Price declines. Here in the era of low- or no-down payment, price has become a huge factor in foreclosures. The more prices fall, the more people are left paying giant mortgages on homes with zero or negative equity, making foreclosure a fairly painless option. As the price declines continue to spread to the higher end submarkets, instances of foreclosure could increase in those areas. (On that note, I am fairly convinced that the price decline will continue to spread to the more expensive areas — I intend to write an article on why that is at some point, but in the meantime, the venerable Pigg known as Bugs has written some excellent analysis on that topic in the forums and comments).
- Job loss. The 1990s bust was more of a job-loss driven downturn, while this is comparatively more of a financing-driven downturn. So most of the problems are cropping up in the areas where people were most dependent on wacky financing. However, if we do get more widespread job loss either as a result of the housing crash or from housing’s second-order effects on the overall economy, this could change in a pretty big way.
But that’s all speculation on the future — for now, let’s bear in mind that the above charts hide some pretty big regional disparities in foreclosure activity. On the whole, however, San Diego’s foreclosure situation is like absolutely nothing we’ve ever seen.
Its great to see such
Its great to see such copious posts coming from the good professor. We havent seen this many in a long time.
Rich,
Thanks for yet another
Rich,
Thanks for yet another great post. At the risk of sounding like I’m never satisfied, I for one would love to see you post on why you think price declines will happen in the upper priced areas, how you see that happening, and good arguments to the spinmeisters that say areas like La Jolla will never go down.
XBoxBoy
Something that troubles me
Something that troubles me about the last graph is the monthly correlation between NODs and NOTs. NODs should preceed NOTs by 3 to 6 months. Why the blips happening at exactly the same time? There must be a reporting error or something.
Nonetheless, this is minor, but would be interesting to understand.
I second XBoxBoy’s motion.
I second XBoxBoy’s motion.
Eventually, the hammered
Eventually, the hammered areas will begin to look attractive to those in the more primo areas looking to capture their equity. When that mindset takes hold, the primo areas will most assuredly fall, as those with a great deal of paper equity have a lot of room to negotiate price.
So at 0.3 sales per default
So at 0.3 sales per default that means for every 3 houses sold, 10 are going into foreclosure?
Couldn’t agree more with the last 3 points. Sub-prime is currently seen as the only cause of this mess by mainstream. Job losses are only picking up steam, and once they realized we’re in a housing induced recession will only worsen the problem. Socialist Sam will not be much help once Alt-AAA, no-doc, and Neg-Am come home for dinner.
I don’t see any reason why prices can’t fall to 2000 levels
Coop-remember that currently
Coop-remember that currently 66% of NODs are going into foreclosure, so in 3 months there will “only” be about 6.6 foreclosures for every 3 sold, if these sales figures remain constant.
Also, that ratio is only sfr resales. The actual ratio is 0.55 (3299 NOD/1826 sales). This would make 5.5 sales for 6.6 foreclosures if sales didn’t raise going into spring, which they likely will. The current ratio is at 1826 sales for 1461 foreclosures, about 5 sales for 4 foreclosures. Still extremely ugly.
As I’ve said before, once
As I’ve said before, once the REO resales comprise 30% or so of the total they run the table. Watching two banks compete with each other for the same buyer is the 2008 version of the ad jingle “When lenders compete, you win”.
Everything beyond that is just dogpiling.
I do think we will see more
I do think we will see more trouble in the higher end markets
Rich, when you say we’ll see more trouble in the higher end, did you mean properties like this?
Rich good post. I do agree
Rich good post. I do agree with the spread to the higher end areas however I do believe it will happen in a slower manner then many hope for it to occur. Also as we see from the current for areas such as 4S and Carmel Valley, those higher end properties that do foreclose tend to sell very quickly.
Indeed, until we do get a hiccup in the employment situation the foreclosures will be driven simply by homeowners not being able maintain payments or realizing that they should not pump additional money into a depreciating asset.
Thus it is my opinion that we will see increasing numbers of distress in areas such as these in a methodical manner that should pick up speed in 08 and then into 09 and 10. If we do see abrupt changes in the employment picture and/or the 10 year treasury yield then we could see acceleration that is so desired by many of us.
SD Realtor
Great post Rich. I love
Great post Rich. I love these graphs. Picture speaks a thousand words.
like SD Realtor mentioned, I think the the big unknown that will affect the speed of decline of the Alt-A type properties is the 10 year T-Bill. The speed it has been moving up the last few weeks is quite frightening.
… or as a professor of
… or as a professor of mine once said:
A word is worth a millipicture.
Hi Rich:
Thanks for the
Hi Rich:
Thanks for the information rich charts, especially the ones that extend over multiple years. Getting a graphical view of many years of price and related data is very informative.
One technical issue: On a logarithmic chart, you cannot have a horizontal axis labeled -zero-, since the log of 0 is infinity. So for example on your “Monthly SD Home sales per default + Existing SFH sales divided by NODs” chart, the bottom axis should be 0.1, not 0.
Thank you very much for the graphs!
Mark V
The bottom axis is .1, but
The bottom axis is .1, but since the label is rounded to the nearest integer, it shows as 0. I will try to remember to increase the decimal places next time to prevent confusion.
Rich