Hey all, sorry for the delay… I’ve traveling, but I wanted to at
least put some charts up. Mostly just charts but here are couple
quick observations:
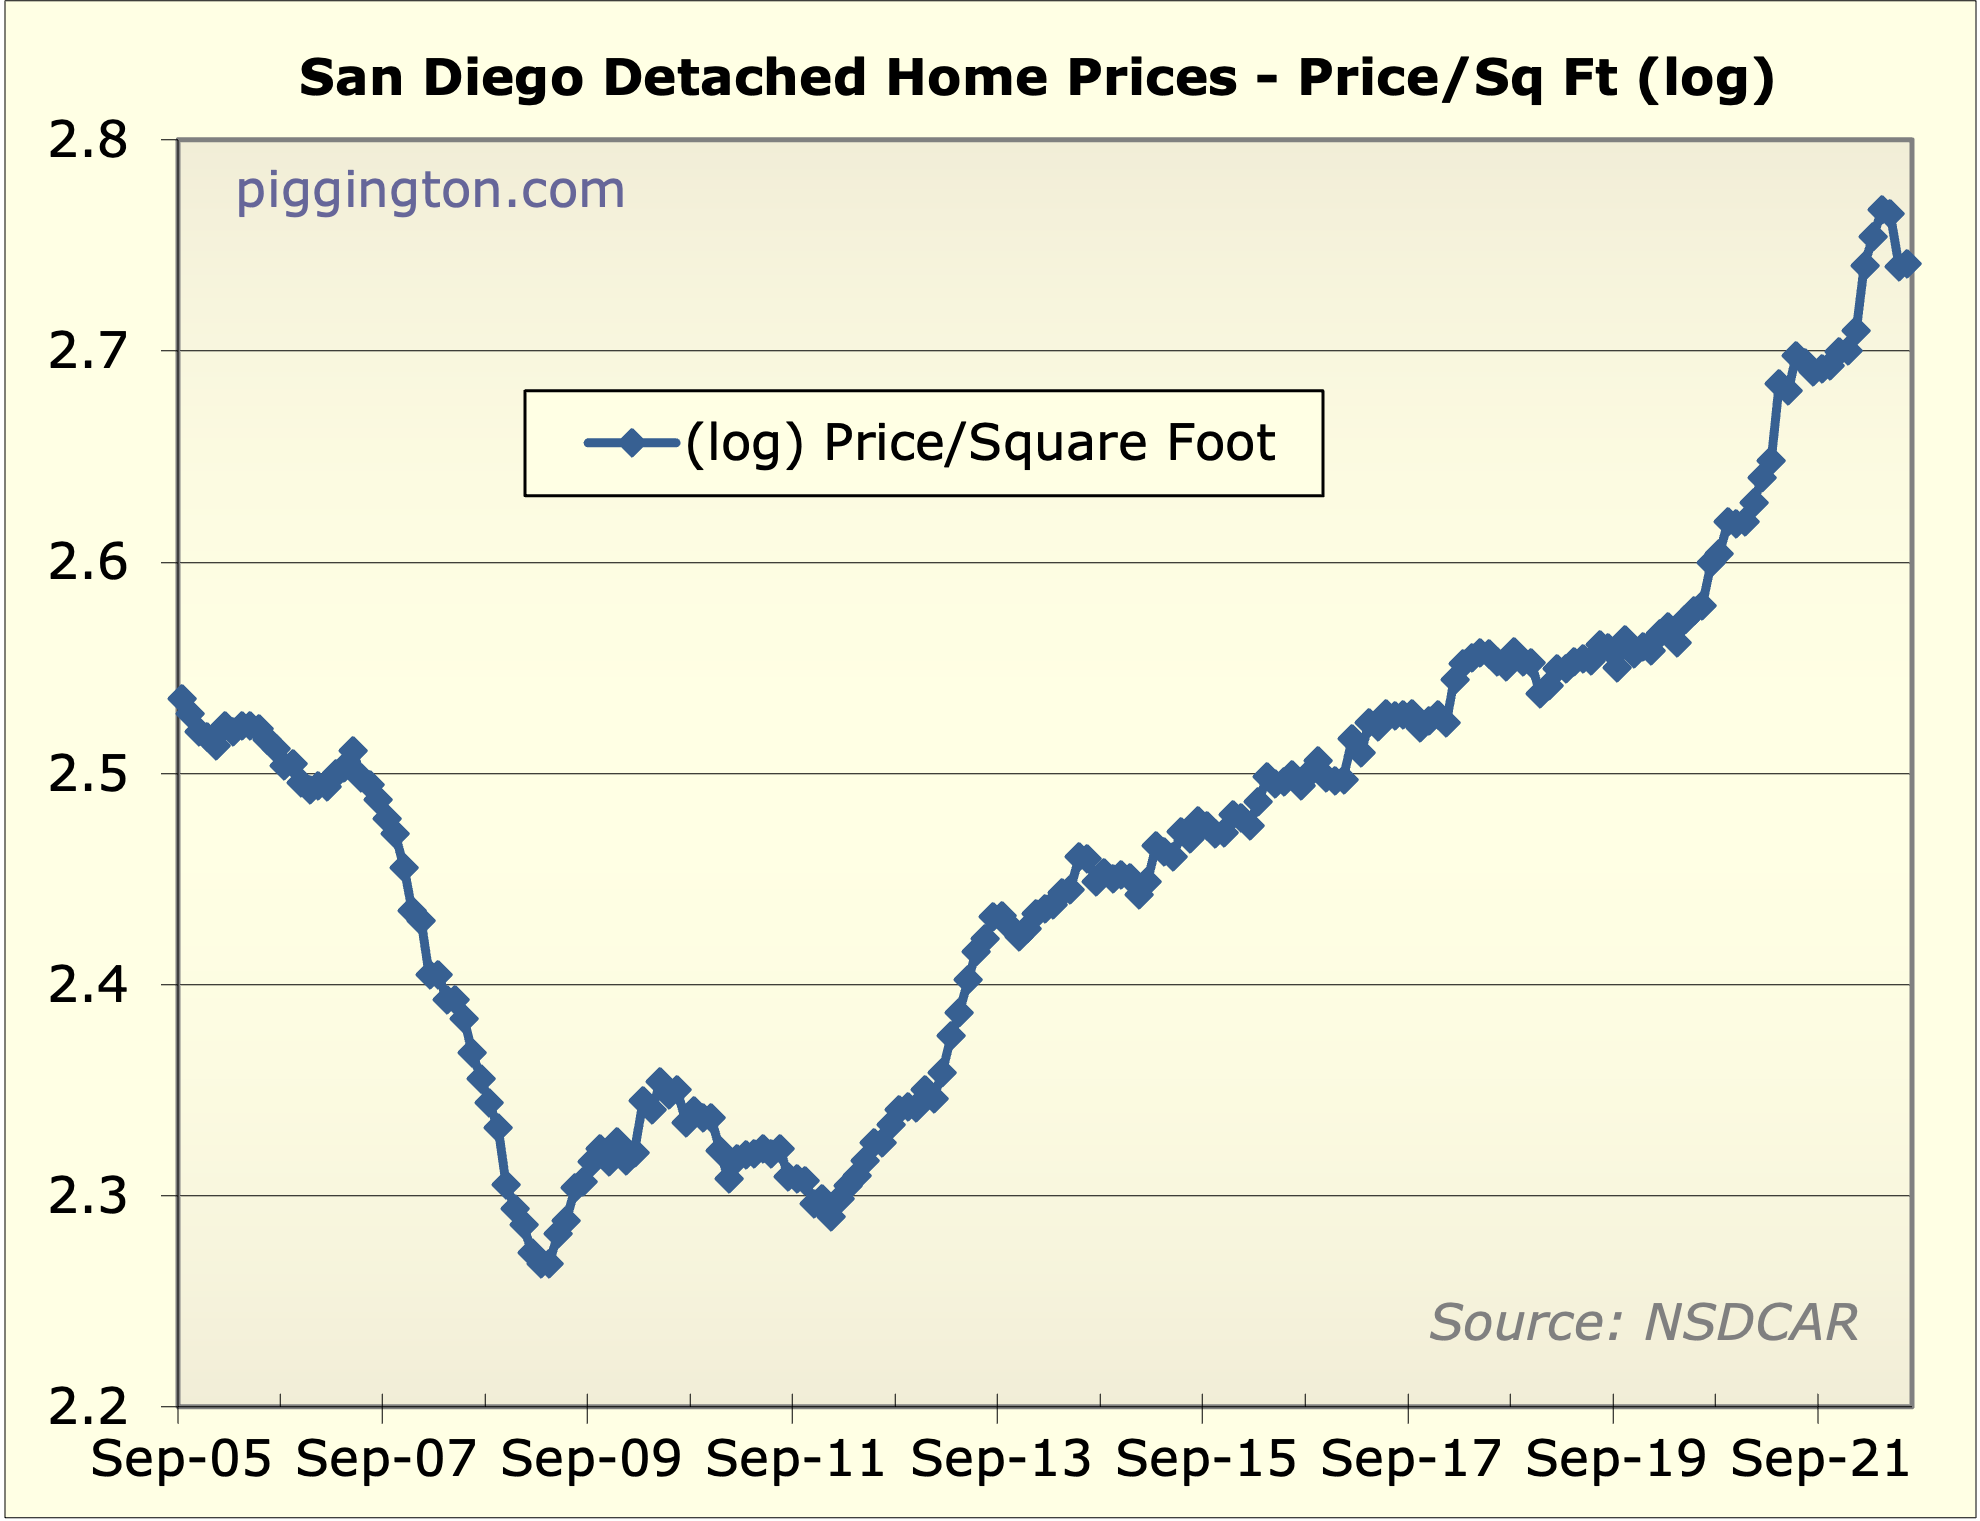
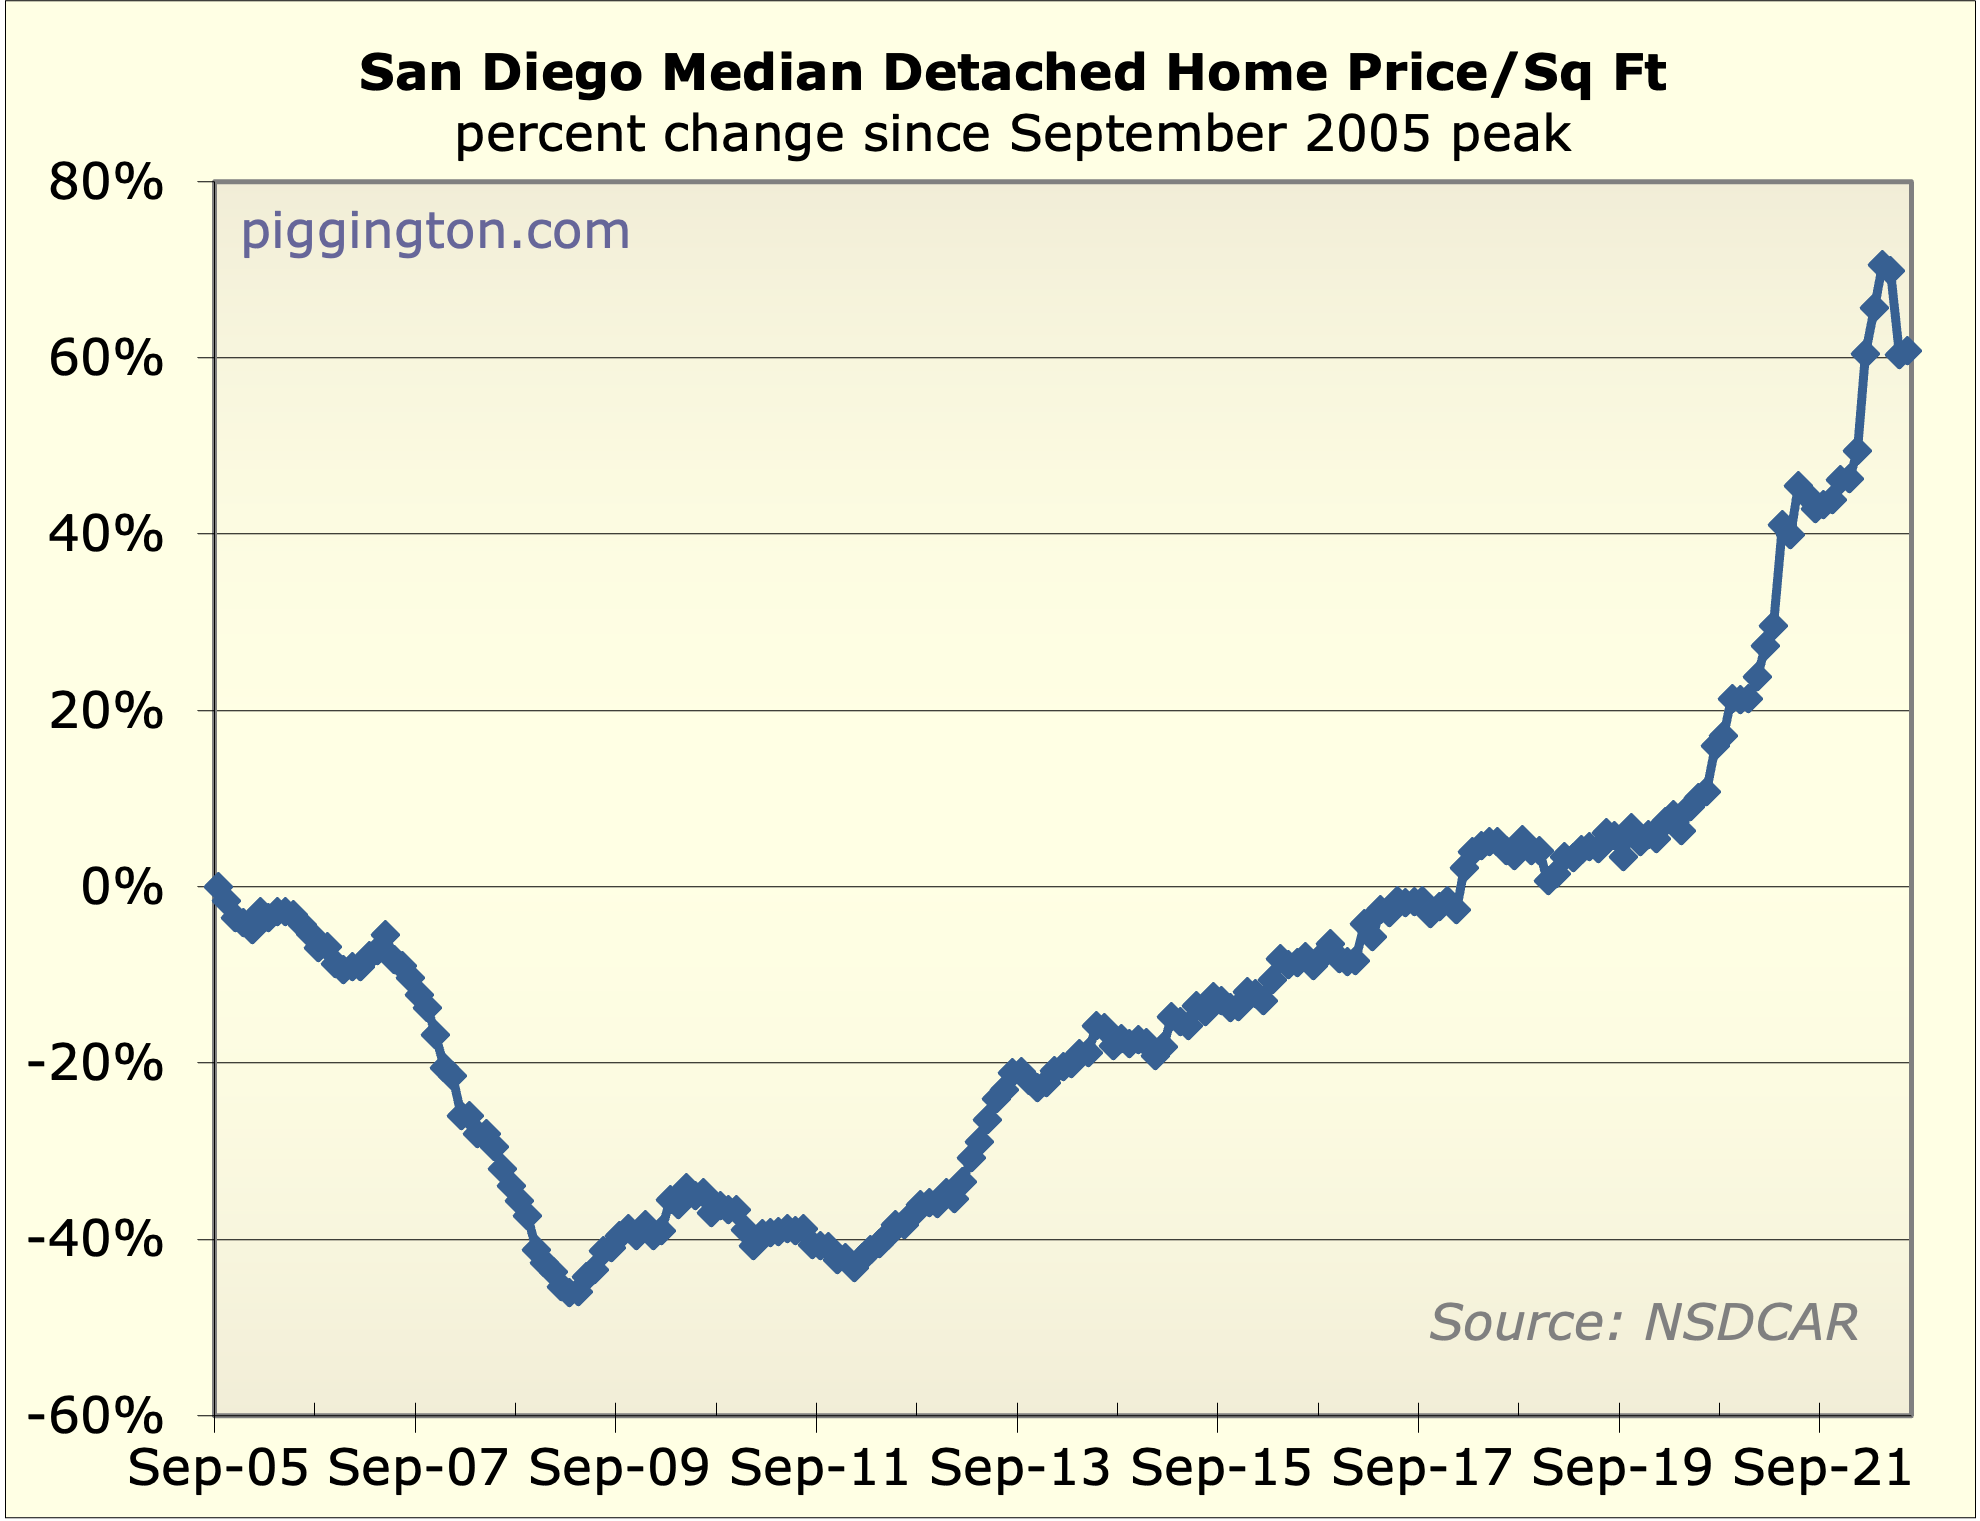
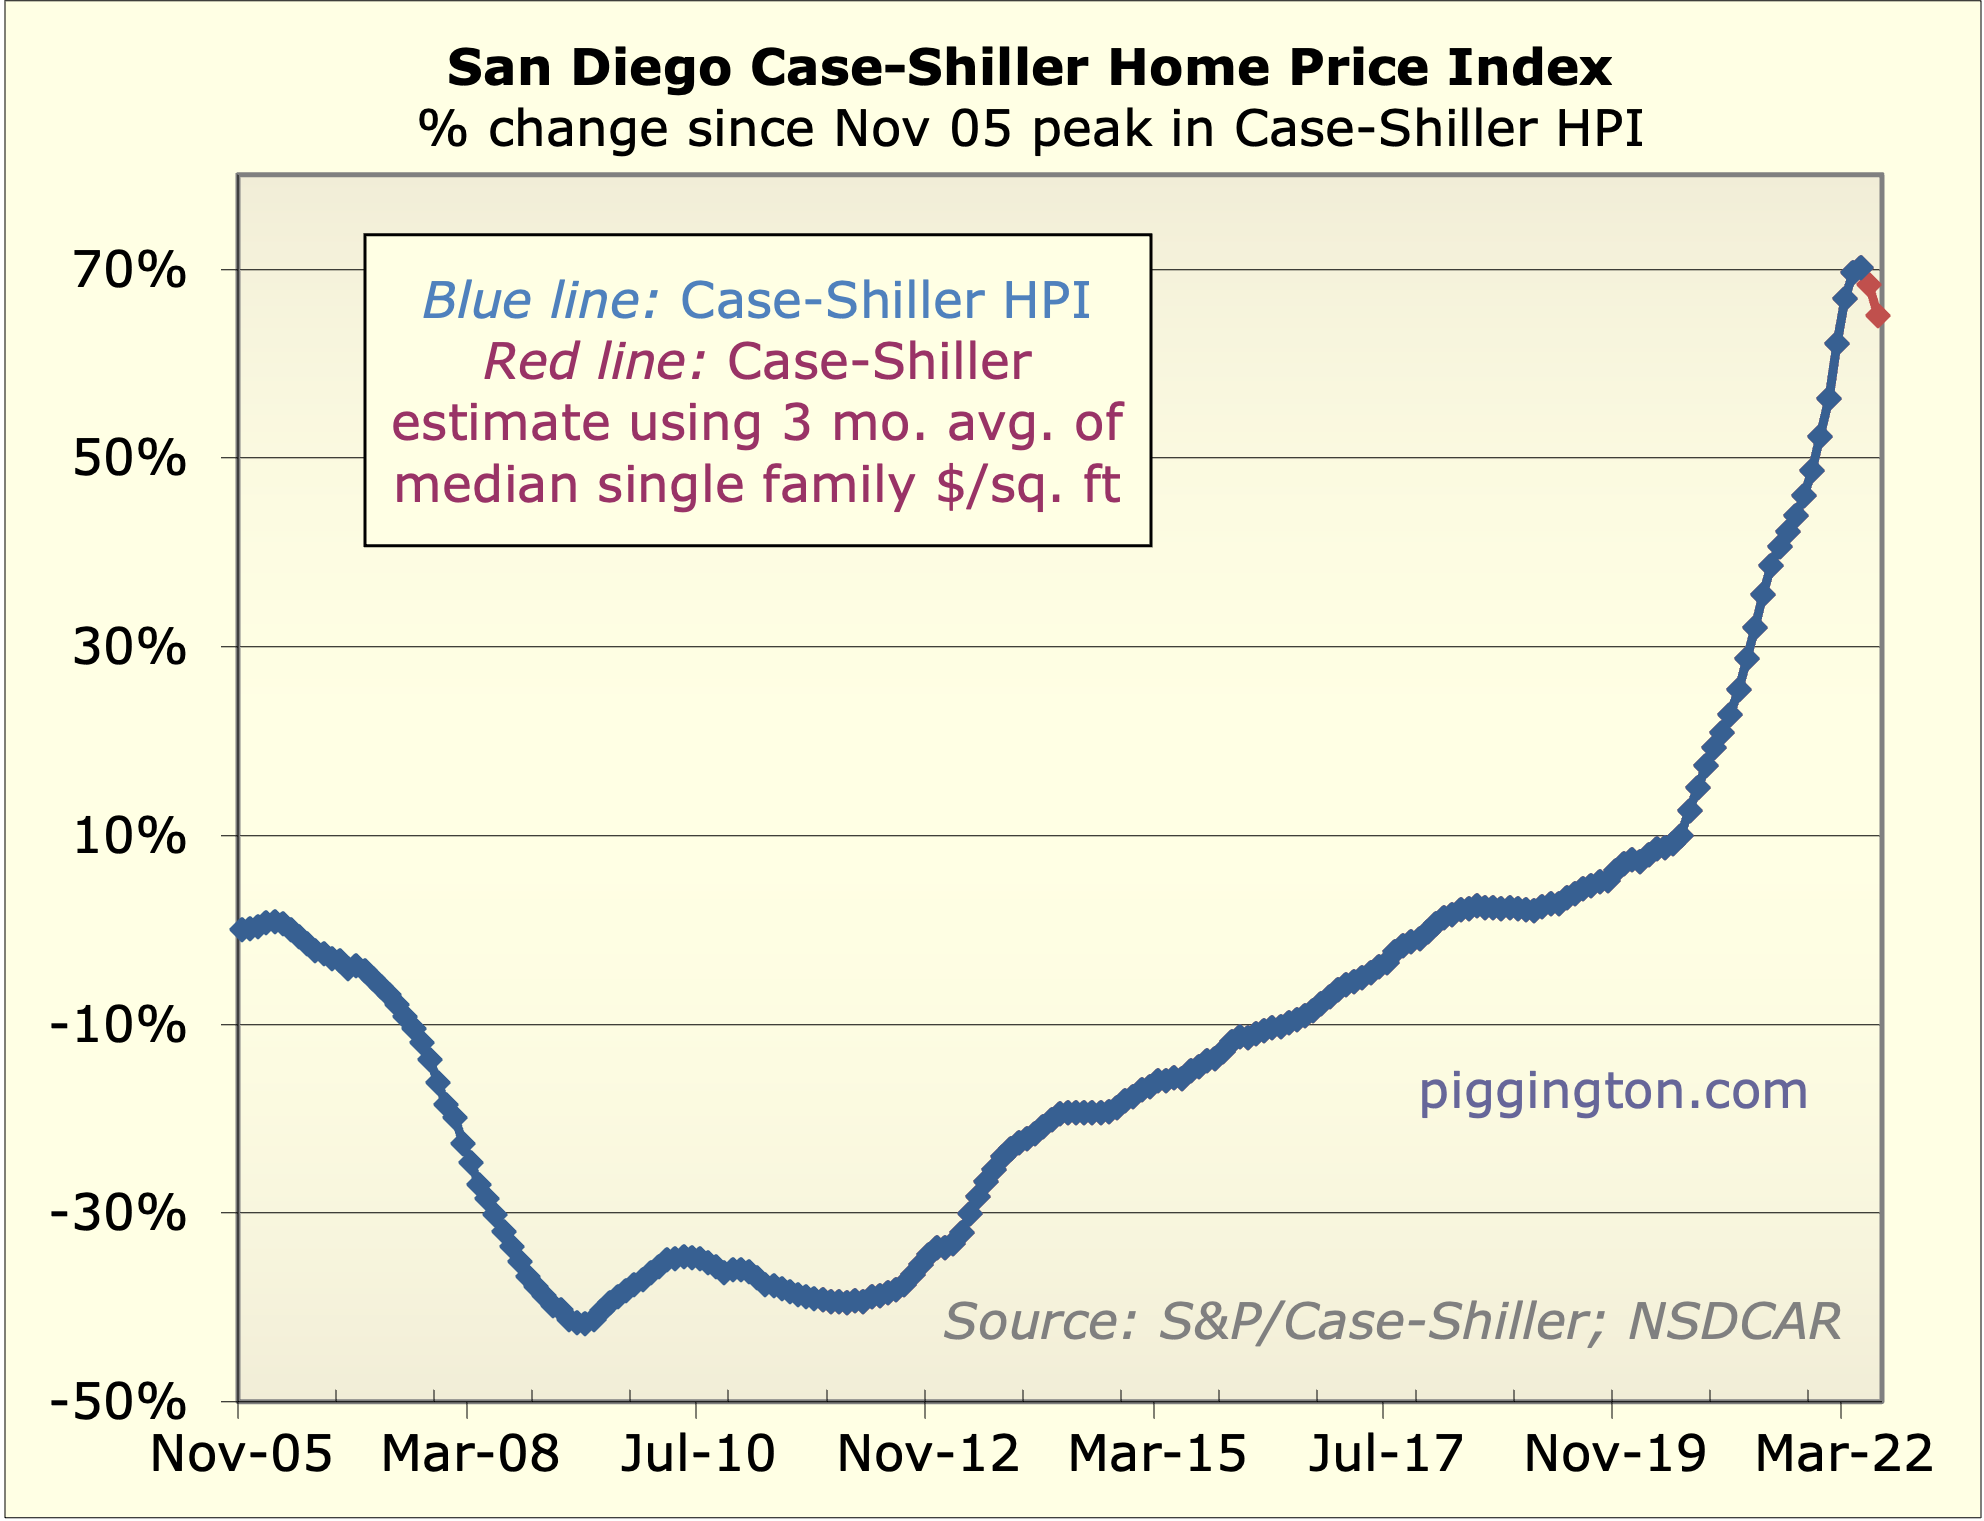
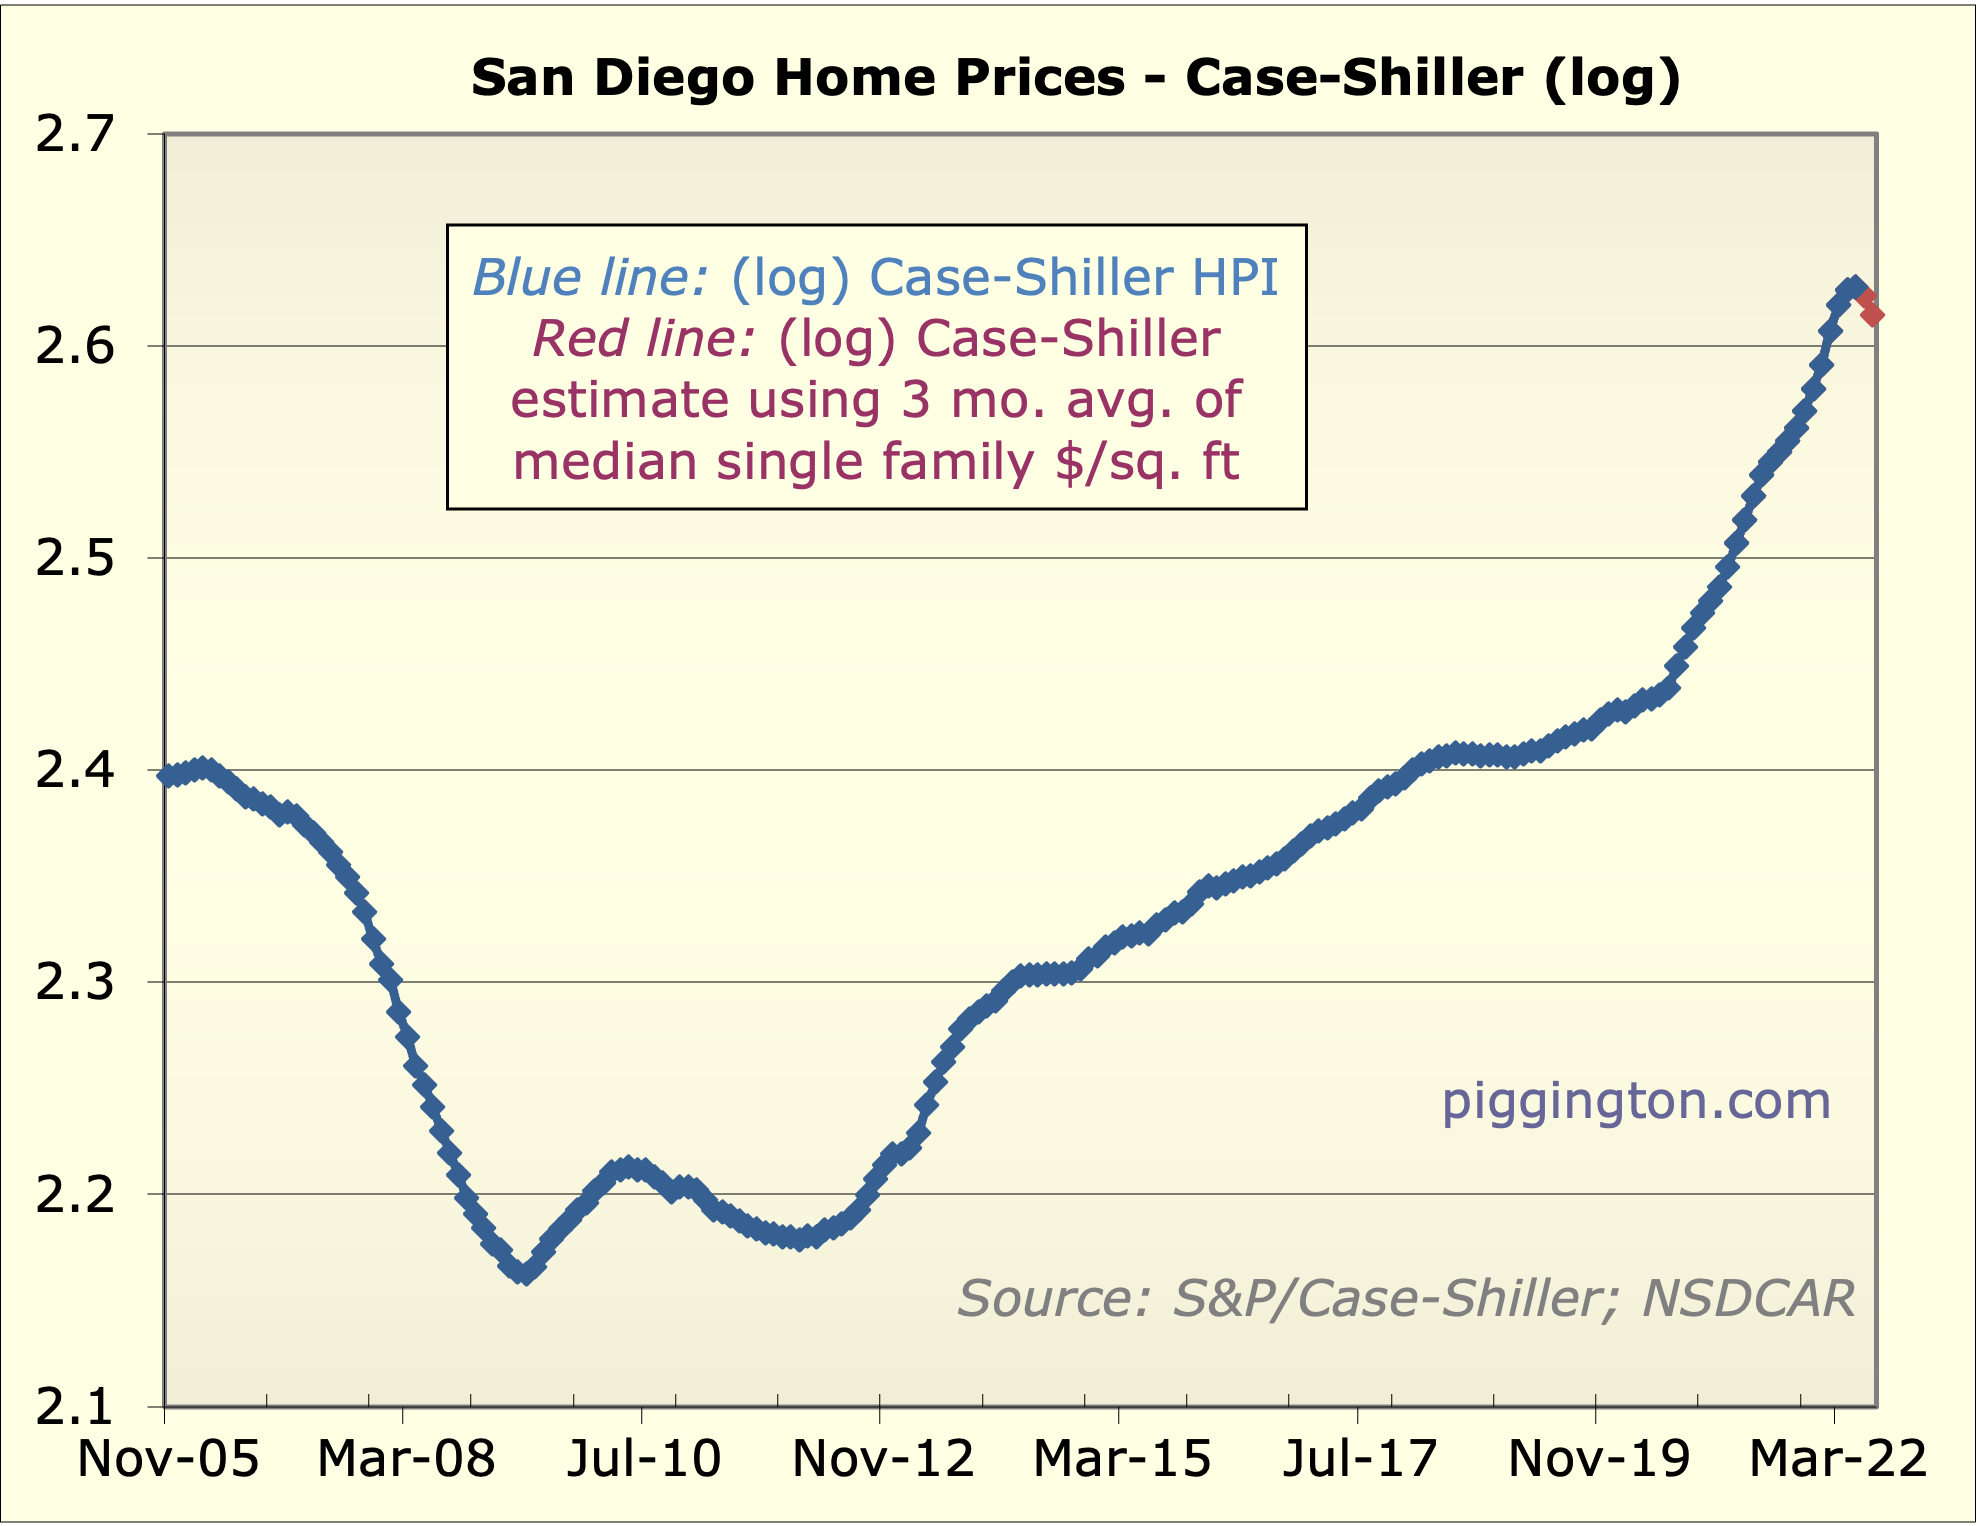
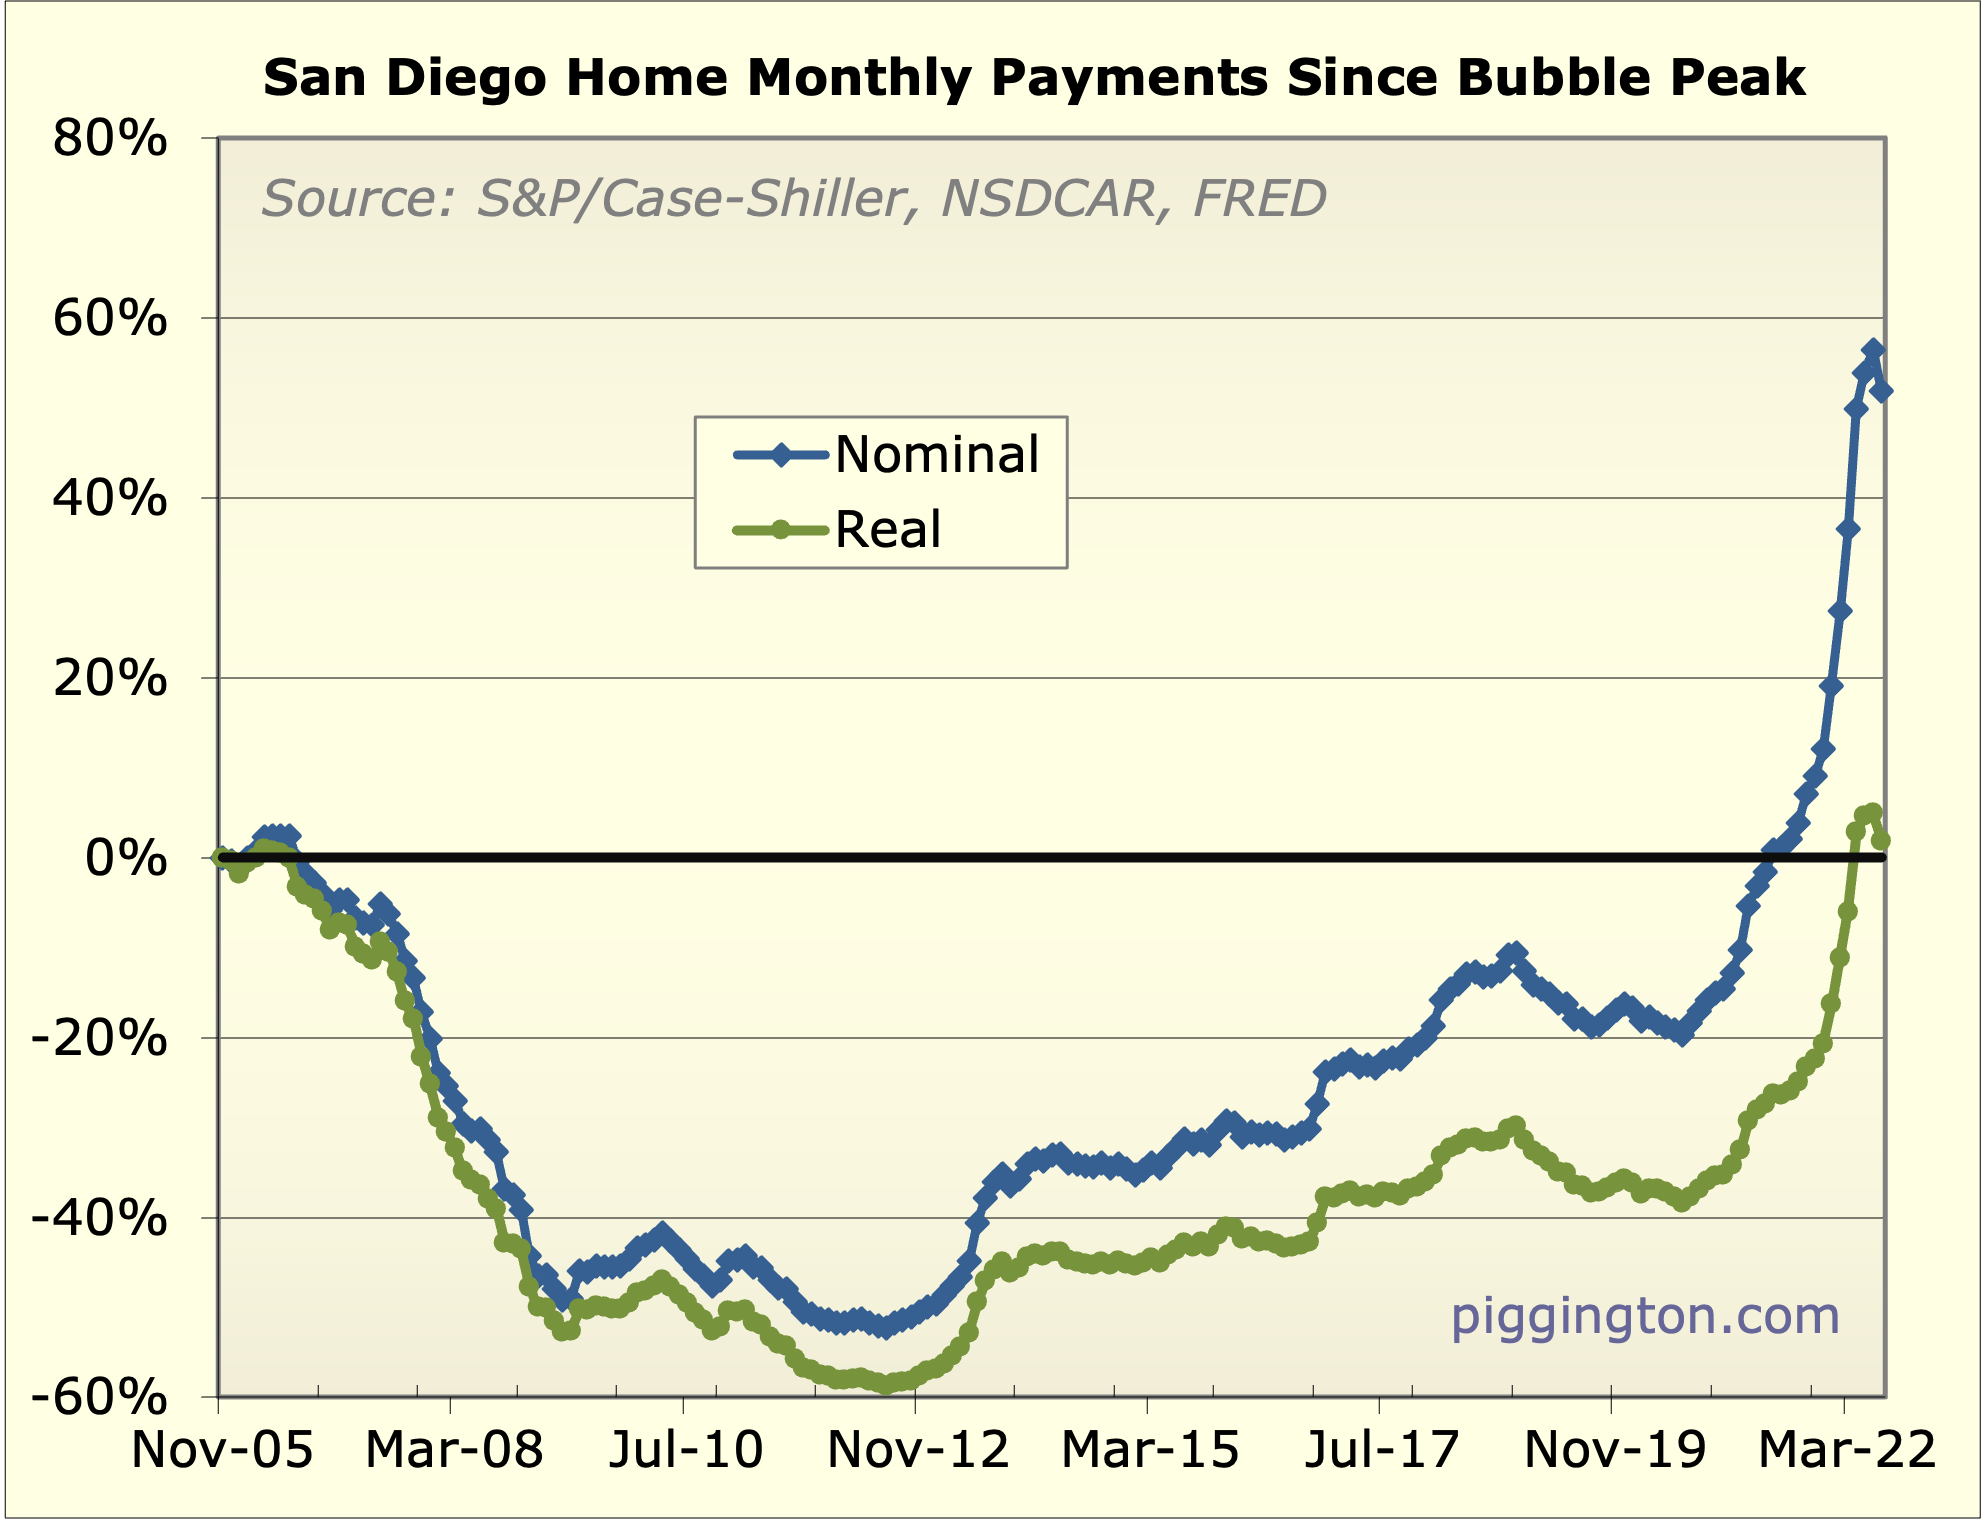
First, the probability grows that there was something to last
months’ price decline, as we’ve had another month at that price
level. (See the prior update for musings on how much of the decline
was real vs. noise). Still, I put a ton more weight on the
(unfortunately 2-month lagging) Case-Shiller index than on the
median price/square foot.
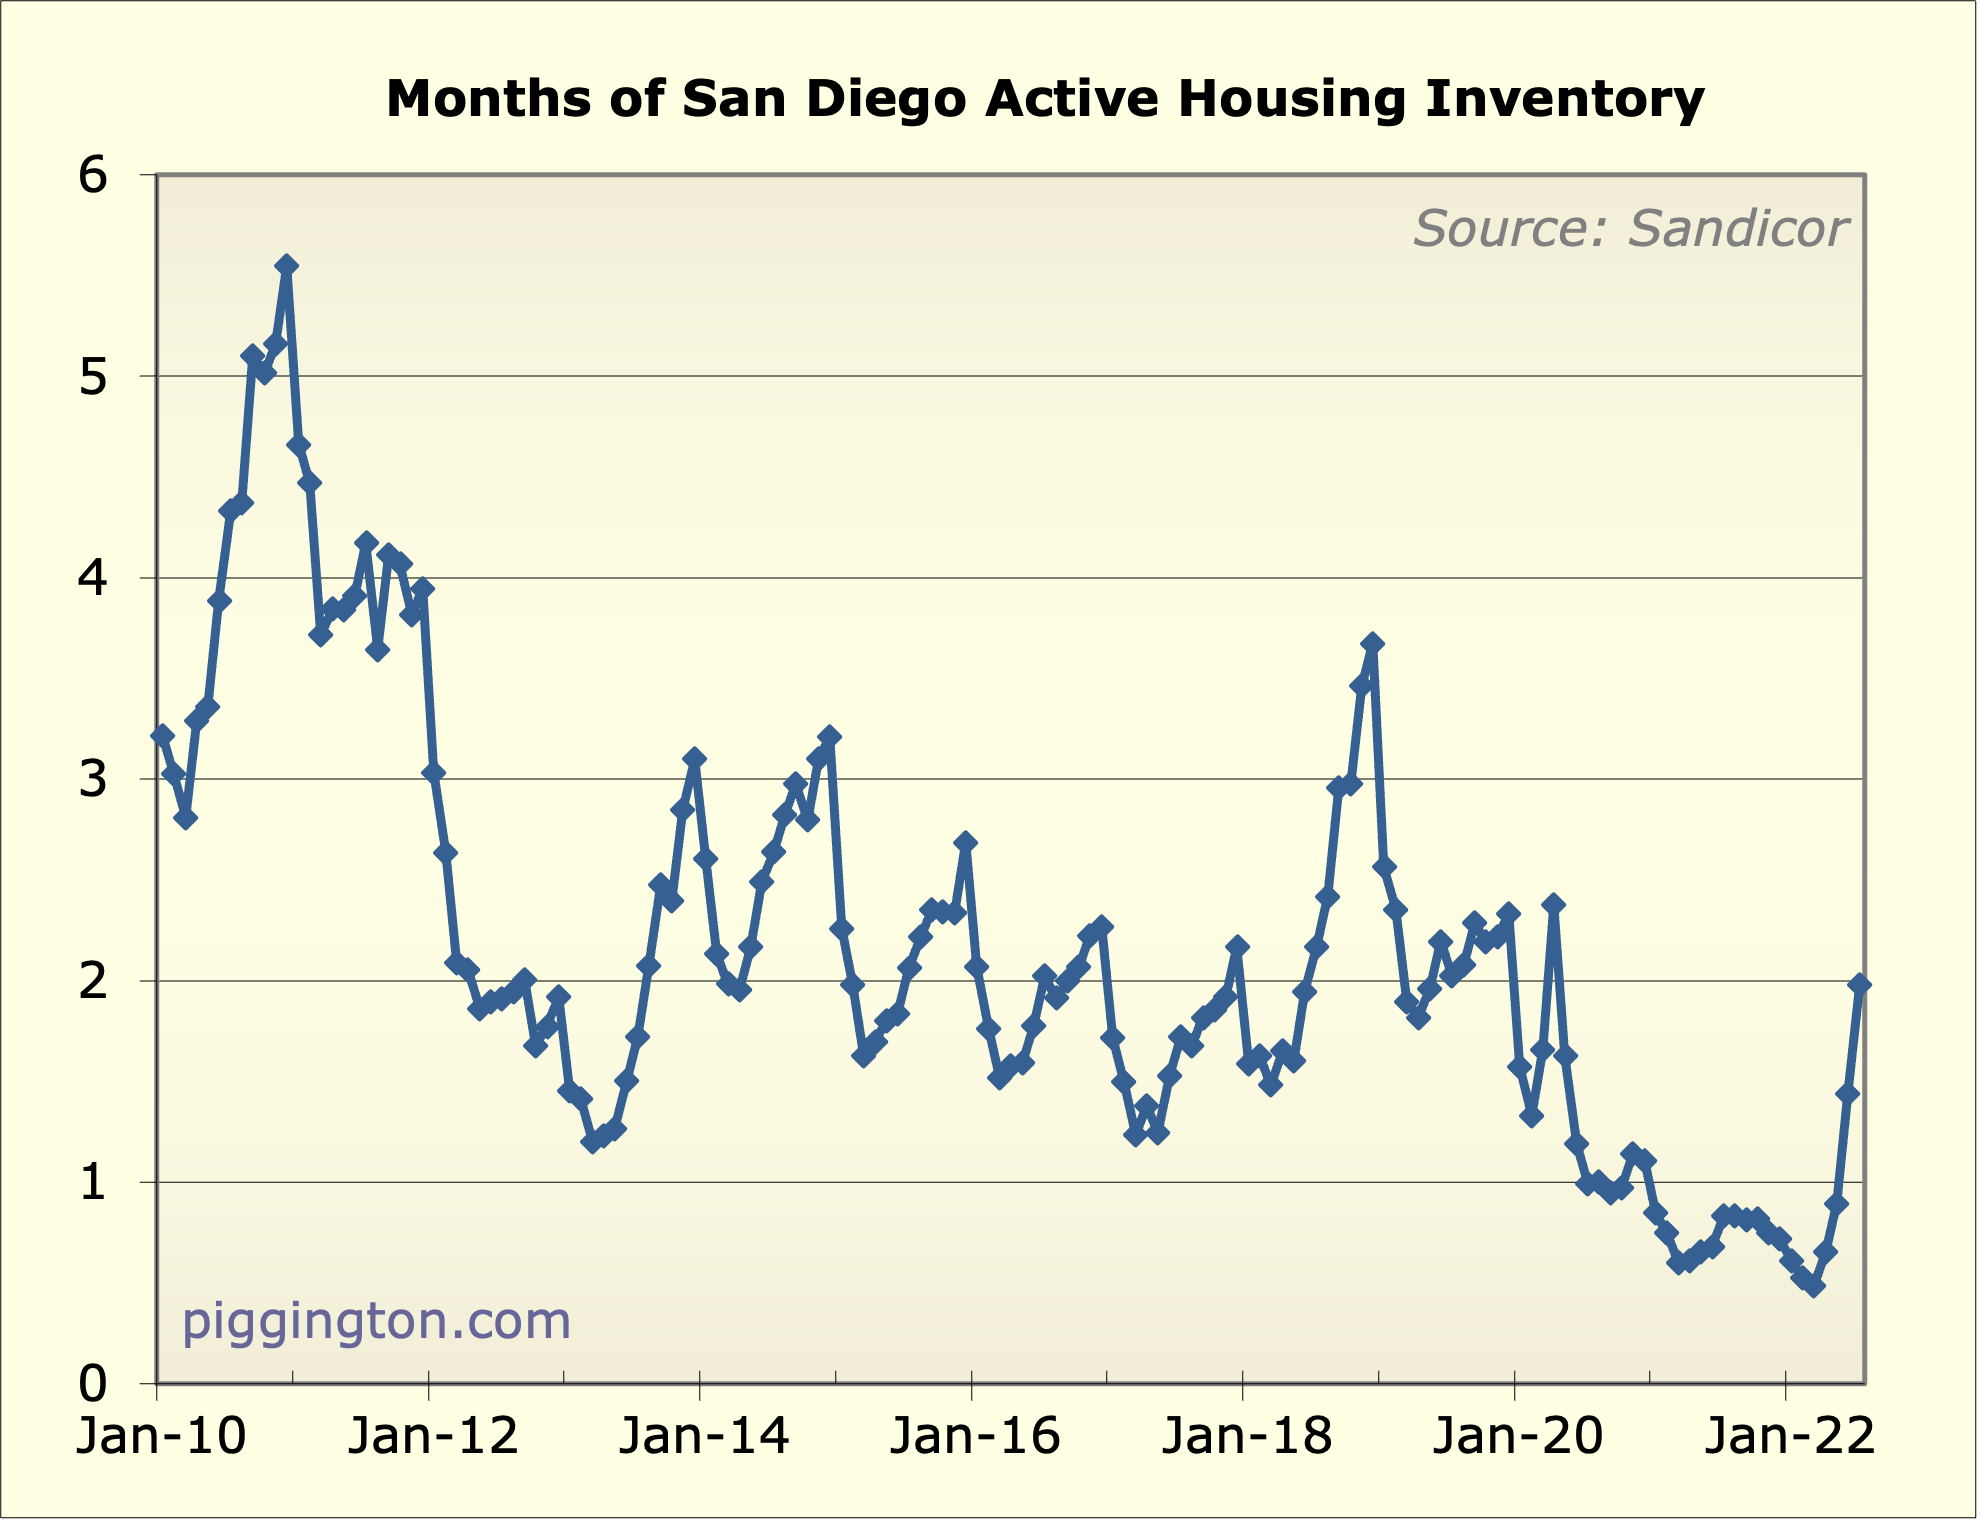
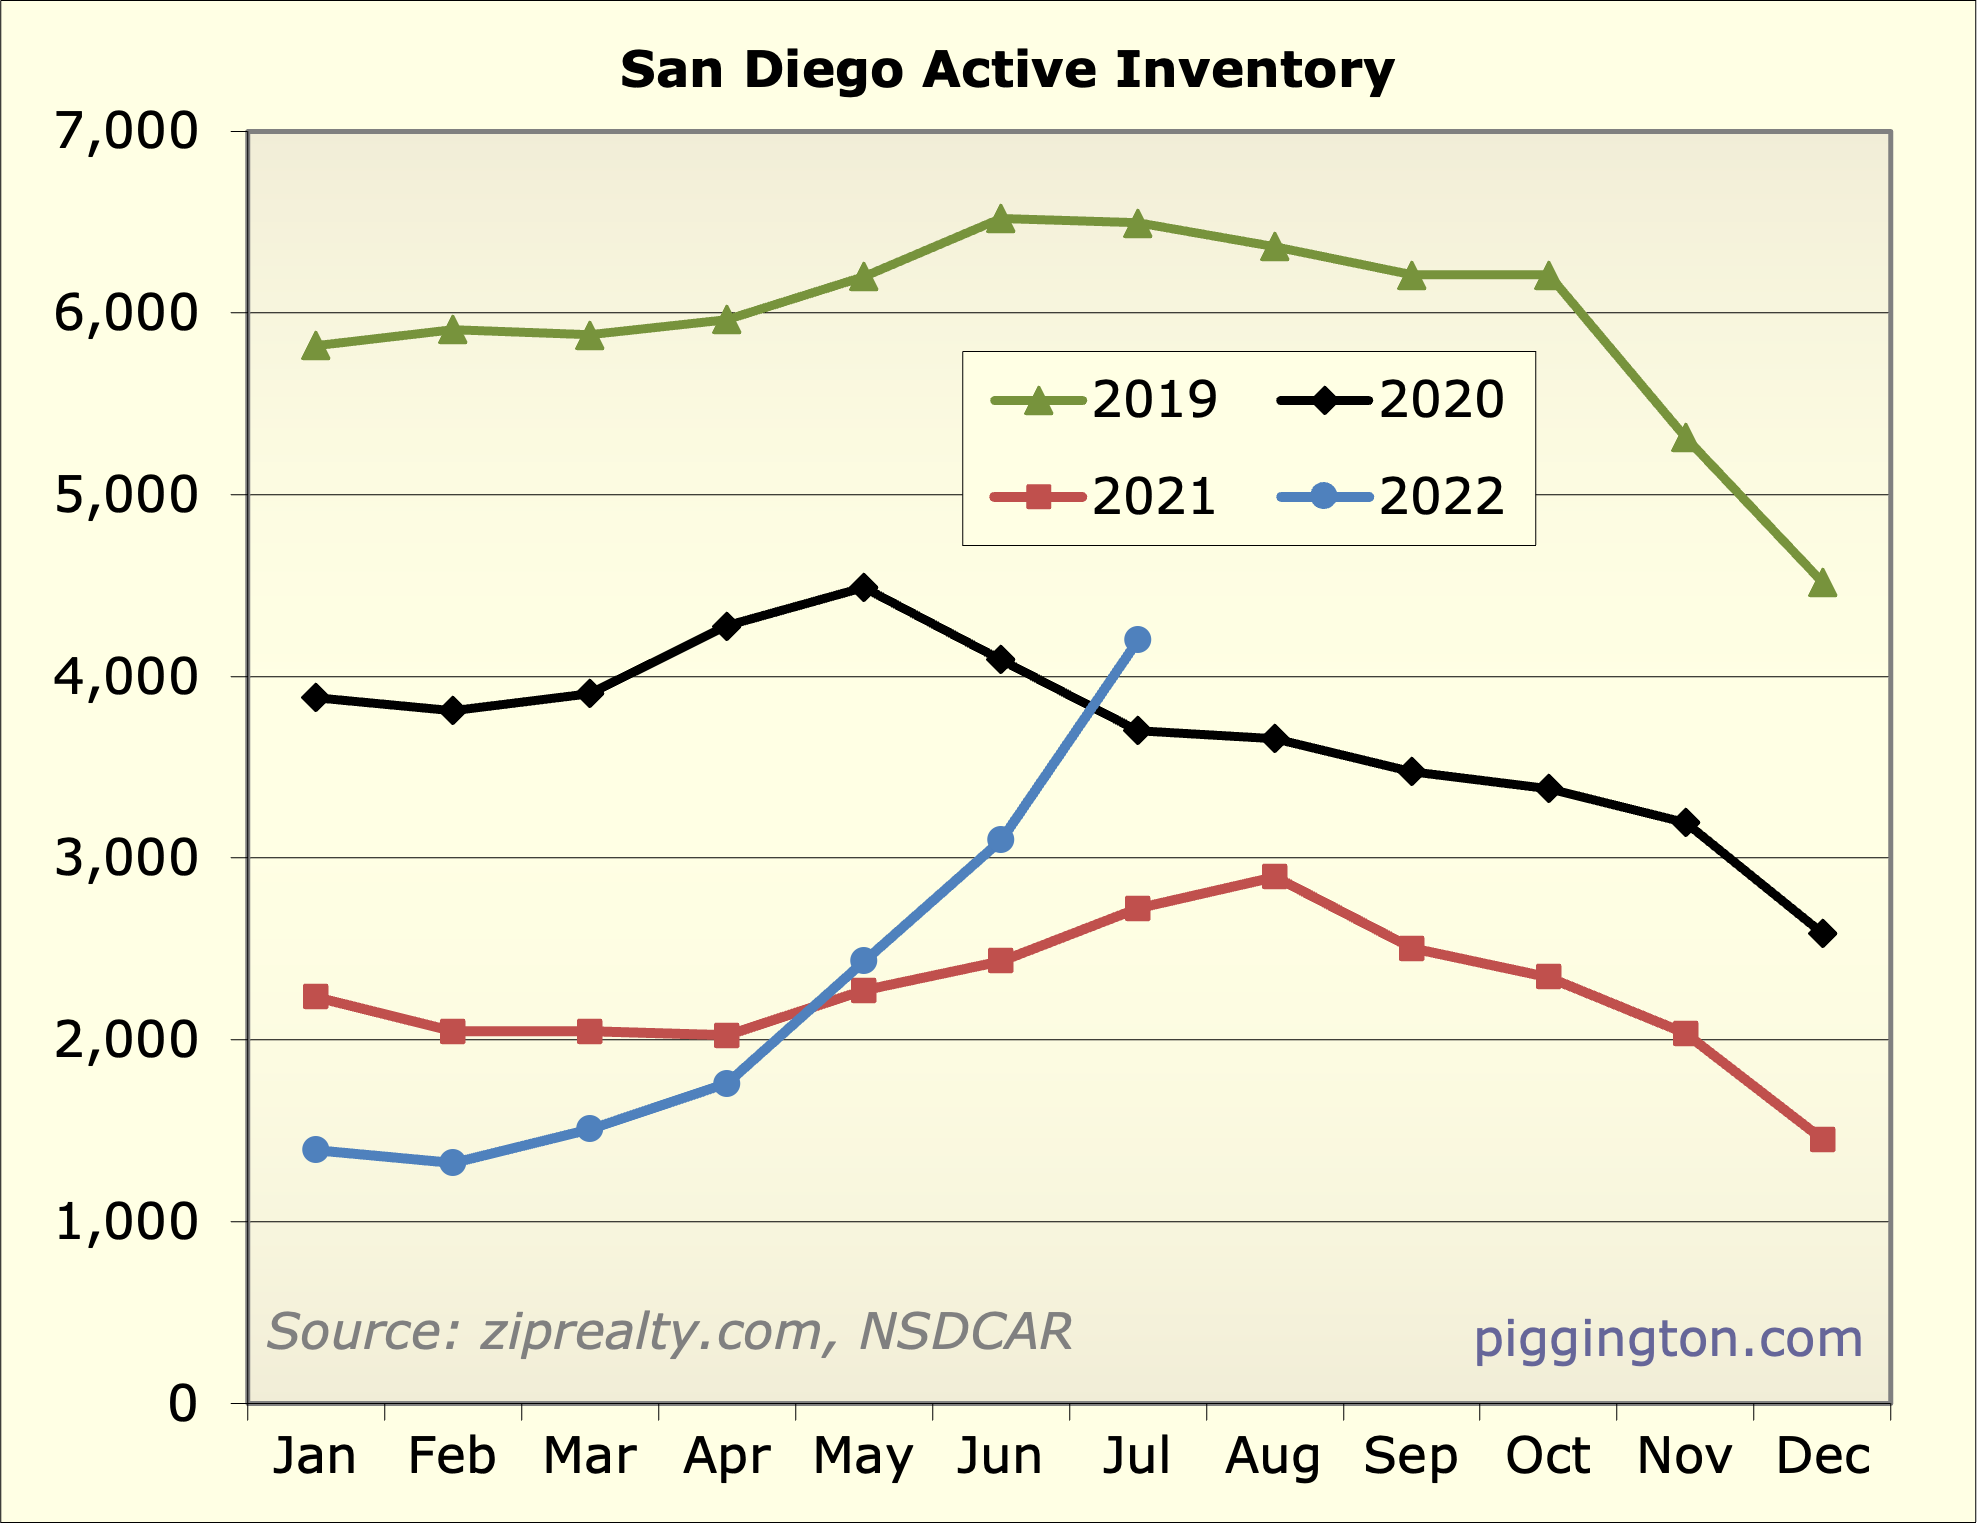
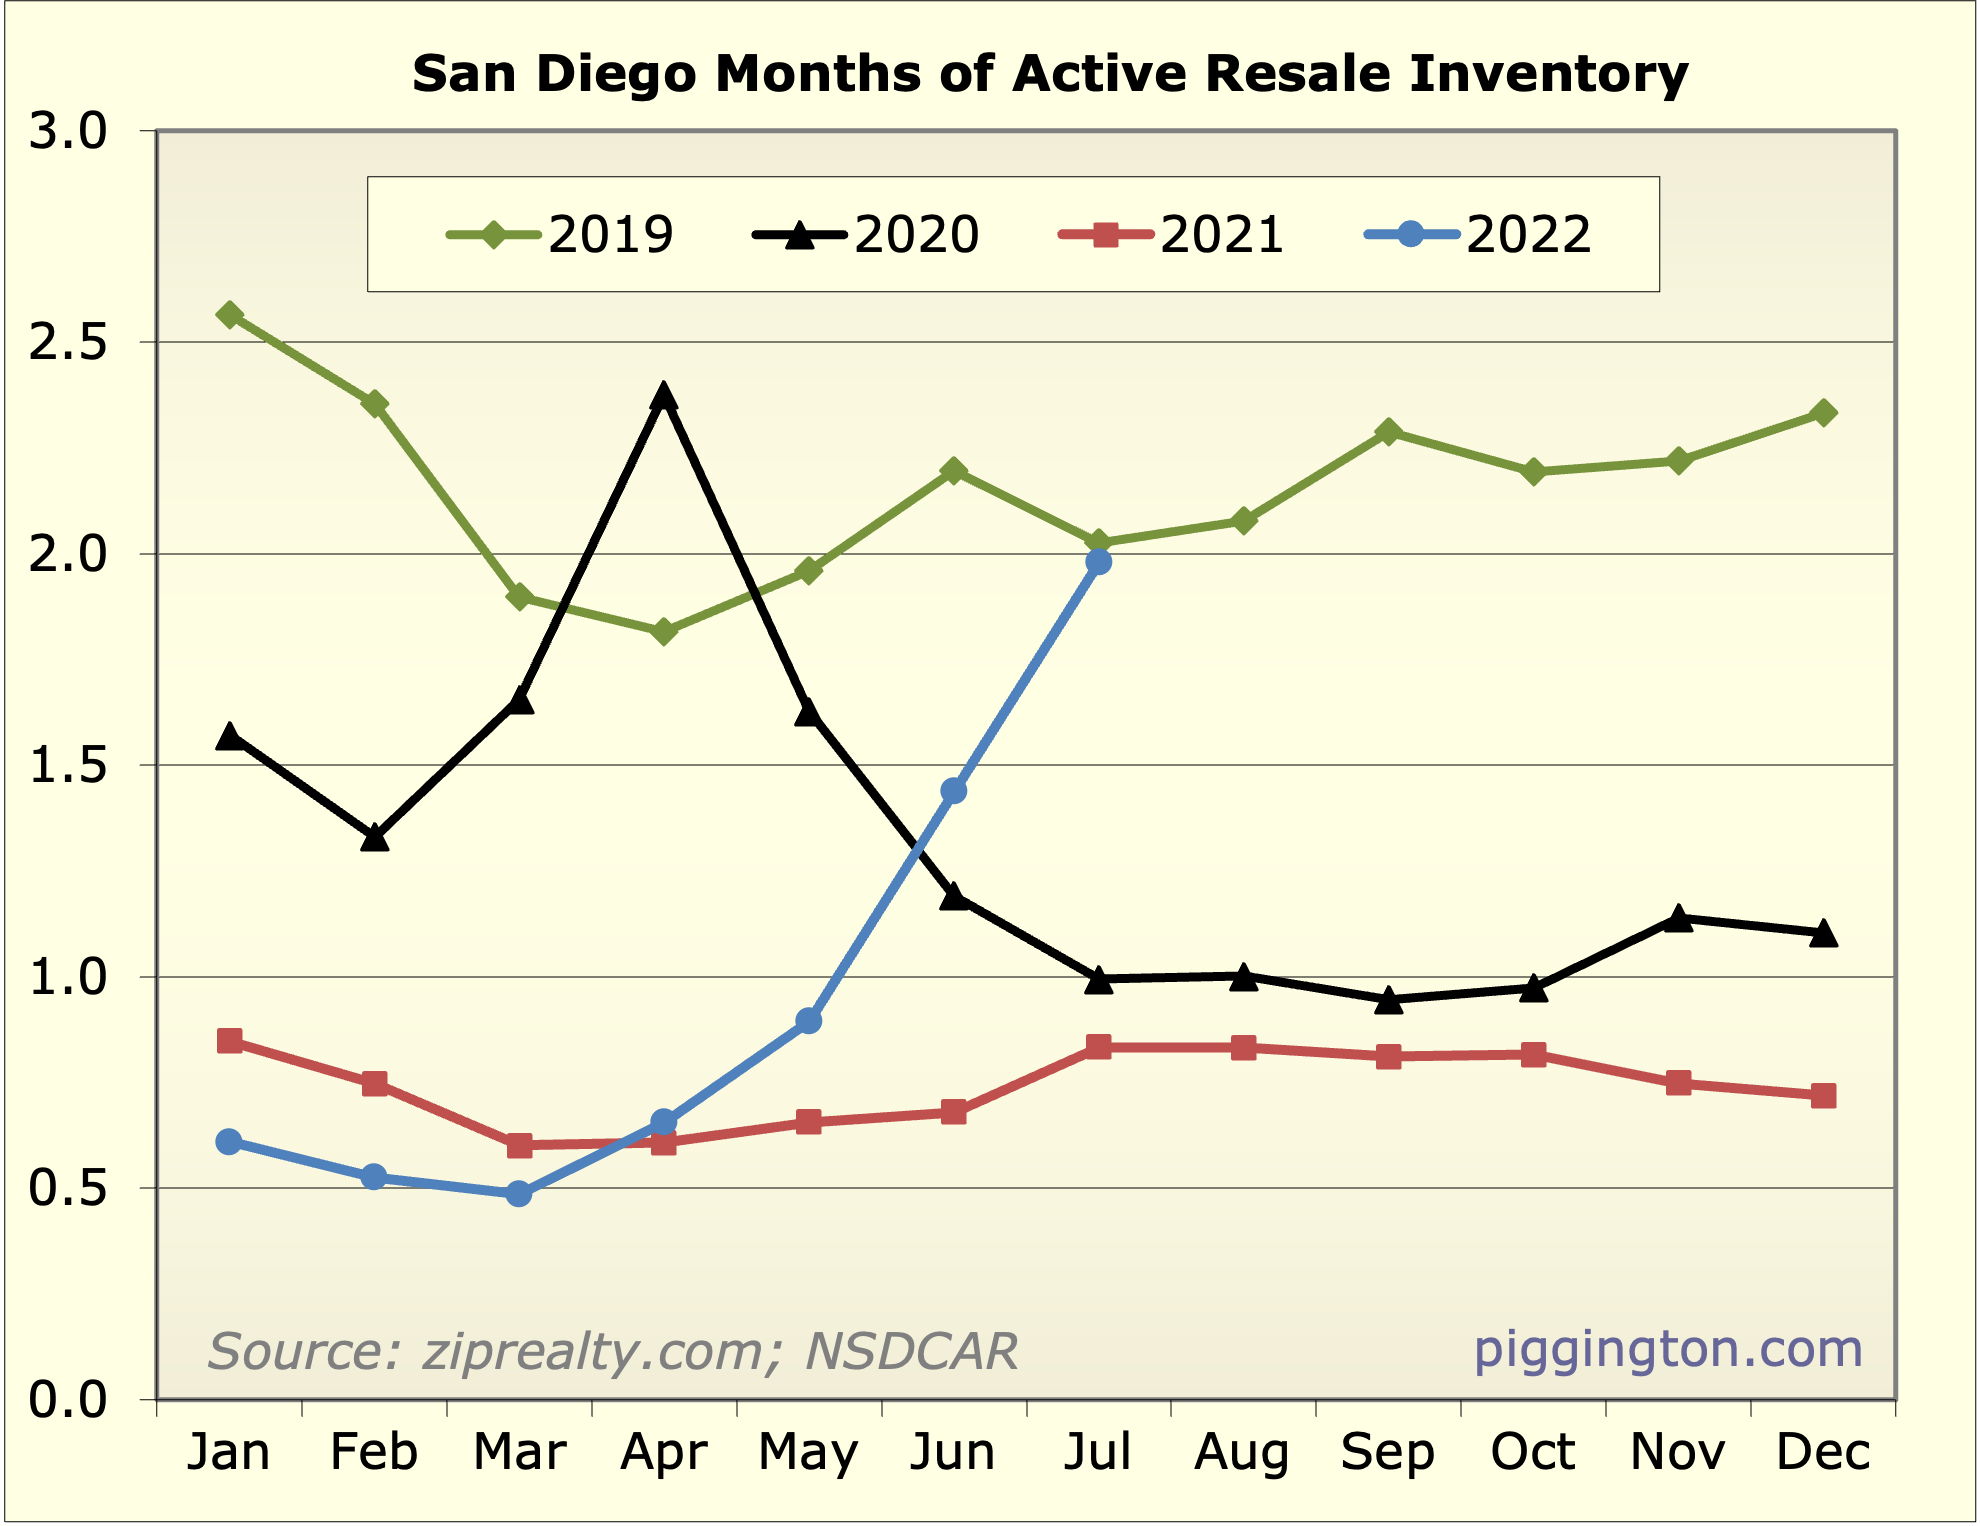
Second, look at that move up in months of inventory. In just a few
months, we’ve gone from epic lows to middle of the road post-bust
levels. I’m very curious to see where that months of inventory
figure goes from here.
More below!

I feel like January-March was
I feel like January-March was the local peak and July the bottom.
The high end East County market I believe fell a solid 12% between those months. The lower prices and lower rates have now caused things to pick back up. Lots of pendings on places I bookmarked.
What I believe will keep driving up prices are huge rent increases and huge increases in nominal wages.
Student loan situation is also bullish. My payments automatically stopped in March 2020. No interest accruing either. Even if it ever restarts, 20% of its real value disappeared. I suspect Biden will unveil mass forgiveness before the election.
This rental report is very informative. 50,000 projected new San Diego jobs in 2022 versus about 2000 new multifamily units completed. And some of those 2000 are just replacing prior units so maybe 1600 net new units.
https://www.northmarq.com/wp-content/uploads/2022/08/NM-Market-Insights_San-Diego_2Q2022.pdf
Some interesting FREDs. Every
Some interesting FREDs. Every single one BULLISH.
Population below poverty in SD has dropped by about 30% since 2014.
https://fred.stlouisfed.org/series/S1701ACS006073
SD population with subprime credit scores has dropped from about 32% to 17%.
https://fred.stlouisfed.org/series/EQFXSUBPRIME006073
Crime has dropped by about 50% since 2004.
https://fred.stlouisfed.org/series/FBITC006073
Nominal total county personal income (not per capita) went up about 9% from 2019 to 2020. That was before the big inflation hit.
https://fred.stlouisfed.org/series/PI06073
Non-hispanic Asian alone population grew by about 30% from 2010-2020.
https://fred.stlouisfed.org/series/B03002006E006073
Months of inventory should
Months of inventory should moderate from here. While sales have fallen the amount of new listings is now dropping as much or more. Looking around my hood I see a lot of the last of the spring price madness has been given back. I’d say maybe 10%ish. We may get that back next spring but for now it’s gone. It’s looking like a slow sluggish fall and winter with some opportunities out there but for now I think spring is gonna pop again.
These charts are starting to
These charts are starting to look awfully familiar.
JPJones wrote:These charts
[quote=JPJones]These charts are starting to look awfully familiar.[/quote]
There is a big lag and in a couple months I’d expect them to show what has already happened. Im seeing lots of things closing 10-15% below what were absolute peak pricing based upon a very small number of sales. Im also seeing no seller panic. There are some with tons of equity who are fine taking what the market will give them now and more who who wont either by standing firm on price or not even bothering to list. There really isnt much in the way of distress that I see and new listings are very subdued. I think a lot of the decline we are going to see has already happened. While I’d be perfectly willing to admit I was wrong if that is the case I dont think so. Expect the graph to show 15% declines off peak levels by y/e and then its back to Spring which I beleive will support those levels nominally. The fun part comes now which is watching to see what actually happens. I like my horse.
FWIW Zillow has my house down
FWIW Zillow has my house down 9% in the last 30 days which is catching up on what happened here since mid May. I think thats about right. Had I wanted to and been one of the few to list/sell between Feb and May I couldve gotten about 10% more. But as Ive mentioned many times to me those prices never felt real. They were extreme scarity fueled with low rates turbocharging demand. Looking forward to return to normalcy next year.
BTW rents for a 4BR house around me start around $4500 and realistically $5K+. Thats a lot of do re mi to ride out any softness while sitting on sub 3% mortgages
Hoocoodanode?
(That was in
Hoocoodanode?
(That was in response to JPJones’ comment)
Illuminating charts, Rich, as
Illuminating charts, Rich, as always.
More bottomming evidence from
More bottomming evidence from today:
The National Association of Realtors said on Wednesday that its pending home sales index tumbled 19.9% in July compared with the same month one year ago. On a monthly basis, pending home sales dropped 1% – less than the 4% decline projected by Refinitiv economists and the nearly 9% drop recorded in June.
“This month’s very modest decline reflects the recent retreat in mortgage rates,” Lawrence Yun, NAR’s chief economist, said in a statement. “Inventories are growing for homes in the upper price ranges, but limited supply at lower price points is hindering transaction activity.”
gzz wrote:More bottomming
[quote=gzz]More bottomming evidence from today:
The National Association of Realtors said on Wednesday that its pending home sales index tumbled 19.9% in July compared with the same month one year ago. On a monthly basis, pending home sales dropped 1% – less than the 4% decline projected by Refinitiv economists and the nearly 9% drop recorded in June.
“This month’s very modest decline reflects the recent retreat in mortgage rates,” Lawrence Yun, NAR’s chief economist, said in a statement. “Inventories are growing for homes in the upper price ranges, but limited supply at lower price points is hindering transaction activity.”[/quote]
This only indicates that things have been going down. It does not indicate bottoming. I think we still have a ways to go. Time will tell.