October was a down month for the median price per square foot. By
this measure, detached homes were down .8%, condos by 3.3%, and the
aggregate number by 1.6%:
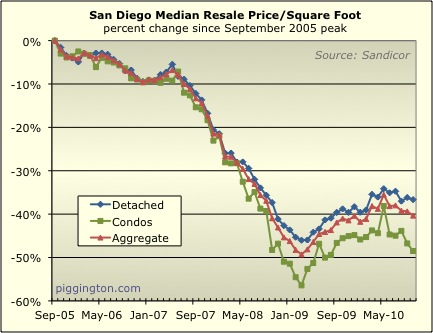
Remember that the condo median is very volatile, so the single family
number is probably giving a better read on what’s going on. Any
way you slice it, though, it looks like overall prices dropped in
October.
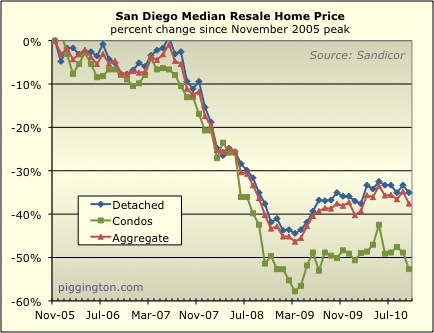
The plain vanilla median, for what it’s worth, fared quite a bit worse:
down 2.6% for single family homes, 7.5% for condos, and 4.3% in
aggregate:
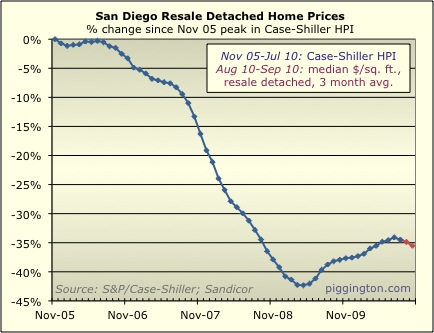
My Case-Shiller proxy unsurprisingly projects another down month in
October for the home price index:
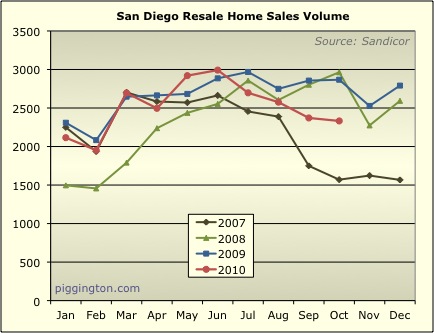
Closed sales dropped slightly for the month:
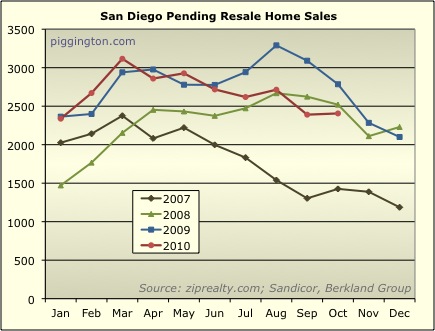
Pending sales were ever so slightly up, however:
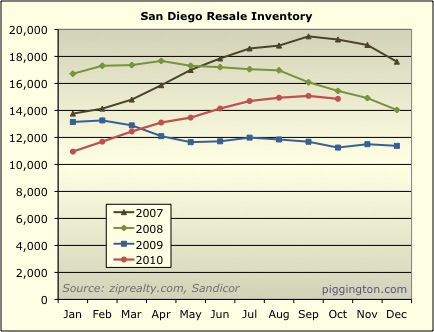
For the first time this year, inventory actually declined, albeit
slightly. Inventory was 32% higher than last October.
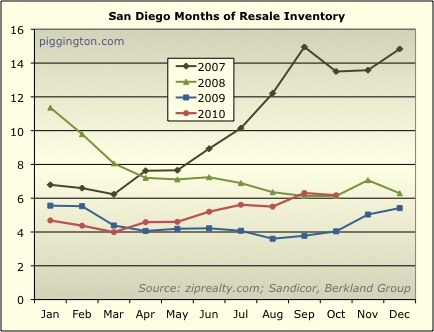
Months of inventory improved mildly between September and October, but
still hovers slightly above the seemingly all-important 6-month level.
It looks like pricing continues to drift downward from the springtime
stimulus-driven peak. And it’s no big
surprise, considering the deterioration in the supply-vs-demand
fundamentals of late. As we head into the end of 2010, things
look very different than they did a year ago. Consider the
following changes between October 2009 and October 2010:
Closed sales: down 19%
Pending sales: down 14%
Inventory: up 32%
Months-of-inventory: up 53%
Over that same year, valuations have not improved in the
aggregate. In fact, October’s Case-Shiller proxy was 4% higher
than the October 2009 index value.
None of this bodes particularly well for San Diego housing in the near
term. But it doesn’t portend disaster either. (Check out
late 2007 on the charts to see what disaster looks like). A
sideways-to-downward drift seems to me like a decent probability for
the months to come.
Of course, external factors could trip this forecast up. One Ben
S. Bernanke will soon start conjuring $75 billion into existence each
month, and contrary to what many claim, I believe that it’s very
difficult to predict (or for that matter control) where newly printed
money will end up. It’s not crazy to suggest that some of that
funny-money could eventually find its way into the housing
market.
On the flip side, a sufficiently serious rise in yields as a result of
a panic out of US government (or government-backed, in the case of
Fannie and Freddie) debt could put the housing market disaster scenario
back on the table. But given that money-printing is still
perceived to be a solution and not a problem, that is likely a topic
for further down the road.
For now, though, these are all just potential spanners in the works, as
the Brits say. Until evidence to the contrary emerges, I’m
sticking with my downward drift thesis…
It’s starting to look like a
It’s starting to look like a “double dip”. Unlike most of the Piggs here I’m looking forward to rates dropping and then a rollercoaster ride up in inflation afterward.
A whole lotta grey. Not a lot
A whole lotta grey. Not a lot of Red or Black directionally speaking. As always, awesome data.
At some point, I would expect you to write a book on all of this. The data and observations from the site would handily fill out a book’s worth and then some of cool data. I’d buy a copy right off the presses and wouldn’t wait for the paperback version.
I do think there is some method to the madness however. I think the Banks and the US government (oh wait, they are one in the same now…) meet regularly to keep the lid on another 2007 style or worse melt down. So, to recap a running theme on this site, there’s a lot of pressure against things settling out in free market style.
Predicting a buyer’s credit resumption in Jan/Feb. Also predicting a more formulaic principal writedown process, backed directly by the government if things continue south. (That’s where some of the $8B will go) And, predicting more outflow of talent from SD to parts east. S’my story and I’m sticking to it!
Ha ha, thanks Higgy, but I am
Ha ha, thanks Higgy, but I am way too lazy to write a book. 😉
I agree that a credit resumption is a possibility in the future, especially if things go south… for now though that’s thinking a few too many moves ahead for my comfort; I’m waiting to see how things play out in realtime…
Rich, do you happen to have
Rich, do you happen to have this data split out by tier (eg, low, medium, high)?
Sorry, no…
Sorry, no…
This looks like a regular ol’
This looks like a regular ol’ Fall downturn to me. The next question is – will the Spring bounce happen in 2011 ?
P.S. Might be nice to see
P.S. Might be nice to see some vertical lines on these charts to indicate seasons, or at least the year end so we can see what typically happens in Fall/Spring … a much simpler request than a book 🙂
sdduuuude wrote:P.S. Might be
[quote=sdduuuude]P.S. Might be nice to see some vertical lines on these charts to indicate seasons, or at least the year end so we can see what typically happens in Fall/Spring … a much simpler request than a book :)[/quote]
I’ve never been able to figure out how to do that in Excel (if it does it at all)… anyone?
Rich Toscano wrote:sdduuuude
[quote=Rich Toscano][quote=sdduuuude]P.S. Might be nice to see some vertical lines on these charts to indicate seasons, or at least the year end so we can see what typically happens in Fall/Spring … a much simpler request than a book :)[/quote]
I’ve never been able to figure out how to do that in Excel (if it does it at all)… anyone?[/quote]
I’m not sure about other version of excel but in the 2010 version, you can choose a different chart layout. There is one that will draw a line straight down from your curve to the x axis.
AN wrote:
I’m not sure about
[quote=AN]
I’m not sure about other version of excel but in the 2010 version, you can choose a different chart layout. There is one that will draw a line straight down from your curve to the x axis.[/quote]
Thanks AN. I am using Excel 2008 for the Mac. Are you talking about the “column” graph type? That wouldn’t really work in the case of multiple line graphs, unfortunately… it would make them quite unreadable (I just tried it out!).
Rich Toscano wrote:
Thanks
[quote=Rich Toscano]
Thanks AN. I am using Excel 2008 for the Mac. Are you talking about the “column” graph type? That wouldn’t really work in the case of multiple line graphs, unfortunately… it would make them quite unreadable (I just tried it out!).[/quote]
Rich, no, I’m not talking about the column graph type. I just check with my Excel 2007 (PC) and the same Chart Layout exist (not sure what it is like on the Mac. If Excel 2008 for Mac have the Ribbon design as well, then after I create a 2D line chart, the ribbon changed into different chart properties. One of the property is “chart layouts”. One of the chart layout preview icon have dotted lines from your data line down to the x-axis. Select that one and it should work.
Hmmm… there is nothing like
Hmmm… there is nothing like that for Excel on the Mac (which is terribly inferior to the Windows version, so I’m not all that surprised). Thanks anyway for looking into it, AN.
AN – This weekend I installed
AN – This weekend I installed the recently released Excel 2011 for the Mac, and I am now seeing what you are talking about (they are called “drop lines”). That’s the good news… the bad news is that they aren’t configurable, so they always drop a line from every single data point, as opposed to every tick mark on the axis. Unfortunately this defeats the purpose for these long-term graphs with many data points… just thought I’d let you know though that they are now available for Mac users. Thanks.
Rich
Rich Toscano wrote:AN – This
[quote=Rich Toscano]AN – This weekend I installed the recently released Excel 2011 for the Mac, and I am now seeing what you are talking about (they are called “drop lines”). That’s the good news… the bad news is that they aren’t configurable, so they always drop a line from every single data point, as opposed to every tick mark on the axis. Unfortunately this defeats the purpose for these long-term graphs with many data points… just thought I’d let you know though that they are now available for Mac users. Thanks.
Rich[/quote]
Rich, I’m not sure if Excel 2011 for Mac have this but once you create your chart, click on the chart and go to the layout. In Excel 2010 for PC, it’s right next to design and format. In layout, you should see an option for “Gridlines”. Click on Primary Vertical Gridlines and select Major Gridline. That “should” give you the vertical lines you’re looking for.
You are correct sir… I got
You are correct sir… I got thrown off by that “drop lines” thing. Major Gridline works just perfect. I will integrate that, where appropriate, in the next round of chart updates. Thank you!
sdduuuude wrote:This looks
[quote=sdduuuude]This looks like a regular ol’ Fall downturn to me. The next question is – will the Spring bounce happen in 2011 ?[/quote]
That is what it feels like to me. BTW, check the last thread. I’m just about ready to declare we are at what I consider a bottom (i.e. a range where deals can be found within 5 to 10% of the best price possible) during this downcycle. I even have my kevlar PJ’s on.
I agree sdr, in my neck of
I agree sdr, in my neck of the woods it is possible to get close to 2001 pricing on good houses (and not just the 1M+ houses either).
Well, I just re-ran my Poway
Well, I just re-ran my Poway search up to $1.5M and there are dozens of homes sitting for 140, 160, 180+ days. Same thing in Santaluz high-end. Check out this noteworthy example in Green Valley:
http://www.redfin.com/CA/Poway/13735-Acorn-Patch-Rd-92064/home/4261042
I’ve watched that since it was listed at $1.25M… and now it’s a $799k short sale.
I think the “hurry up” enthusiasm for the $1M+ price range is starting to wane significantly outside of coastal areas. Combined with stricter lending guidelines, and the fact that 20% down on $1.3M is $260k… I think there’s some air left in the high-end Poway/Santaluz balloon.
Just popped back on market
Just popped back on market (buyer fell thru) – $1.4M in Santaluz – $290/sq ft
http://www.redfin.com/CA/San-Diego/7774-Doug-Hill-Ct-92127/home/6583575
He probably realized the
He probably realized the price was a little stiff for a quasi-twinhome. I always thought that those lots, in particular, were kind of wack-a-doodle. Awesome view of Camino Del Sur too.
If he’d have bought it though, he would have at least had a place to put his, well, everything.
You have to wonder how long
You have to wonder how long this guy is going to try and hold out at $1.595M
http://www.redfin.com/CA/San-Diego/14316-Salida-Del-Sol-92127/home/6637081
When the same floorplan across the street has been listed at $1.025M for 811 days
http://www.redfin.com/CA/San-Diego/14317-Salida-Del-Sol-92127/home/6637074
Seems the market is pretty clearly saying both are overpriced still…
Could look like this for the
Could look like this for the next 5 years:
/////
sdduuuude wrote:Could look
[quote=sdduuuude]Could look like this for the next 5 years:
/////[/quote]
Damn, I was hoping the market would look more like this: (.)(.)
I was thinking something like
I was thinking something like this
——————/´ ¯/)
—————–/—-/
—————-/—-/
———–/´¯/’–‘/´¯`•_
———-/’/–/—-/—–/¨¯
——–(‘(———- ¯~/’–‘)
———————-‘—–/
———-”————_-•´
———————–(
Rising inventory and falling
Rising inventory and falling prices. Someone better get back on the inventory squeezing machine before the winter RE market kicks in.