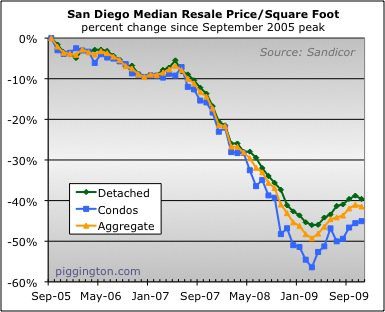
November saw the 7-month rally in San Diego home prices, as measured
by the median price per square foot, come to an end:
I wrote about this last
week, briefly.
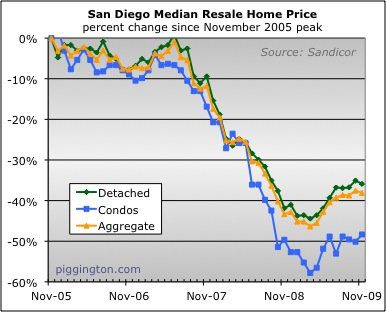
The plain-vanilla median exhibited similar behavior:
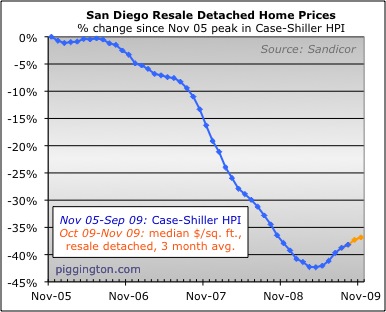
My Case-Shiller proxy kept a-rising
because it’s based on a three-month average of the price data.
This is actually notable because when we look at spring rallies past,
we do so using the CS index. So from that historical standpoint,
the “spring rally” has not actually ended yet:
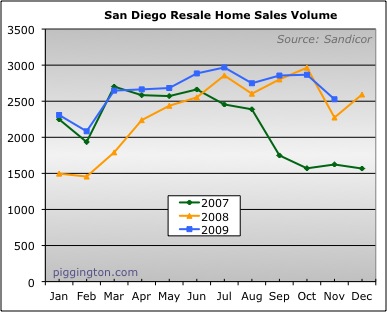
November sales volume dropped by an amount that has been about the
average Oct->Nov drop over the past 5 years (I wrote about this a
bit at Voice):
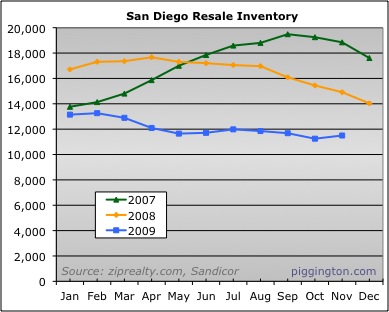
Inventory was up a bit, but at more or less the same level it has
been in recent months.
Months of inventory was up slightly:
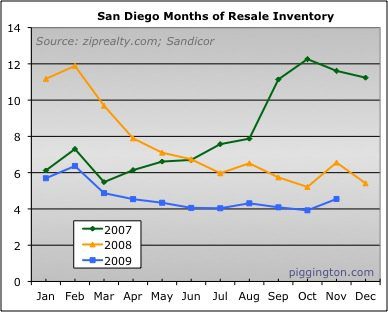
So, we had decent supply and demand, but prices fell a bit.
Perhaps even better
supply/demand fundamentals are needed to push prices up in the face of
widespread unemployment. Or, it could be that sellers are starting to
give way a bit on price. Or, it could just one month’s worth of
noise in the data…
I’m soooo excited for next
I’m soooo excited for next month. I can’t wait to see what color you will use for 2010. Will it be hot pink? Red ? Will Doug Henning make a special New Years appearance ? So many questions.
Ha! I hadn’t even thought
Ha! I hadn’t even thought about it. I was maybe gonna just let 2007 roll off the chart… i thought more than 3 years could make it kind of cluttery. I will take your hot pink suggestion under advisement.
rich
I vote for keeping 2007 as
I vote for keeping 2007 as its a very important year. The graph clearly shows the subprime meltdown/credit contraction cratering home sales and causing inventory to peak. From a historical perspective I think its important to keep that baseline.
How about Chartruese?
sdrealtor wrote:I vote for
[quote=sdrealtor]I vote for keeping 2007 as its a very important year. The graph clearly shows the subprime meltdown/credit contraction cratering home sales and causing inventory to peak. From a historical perspective I think its important to keep that baseline.[/quote]
I agree, please keep it.
[quote]How about Chartruese?[/quote]
I was thinking calico, to chart the downside of the dead cat bounce.
sdrealtor wrote:I vote for
[quote=sdrealtor]I vote for keeping 2007 as its a very important year. The graph clearly shows the subprime meltdown/credit contraction cratering home sales and causing inventory to peak. From a historical perspective I think its important to keep that baseline.
How about Chartruese?[/quote]
Agree! Please keep the 2007 trendline, Rich. 🙂
Rich,
You have probably
Rich,
You have probably answered this in the past, but in your charts you say your source is sandicor .. but they do not supply numbers such as price per square foot as far as I have seen. Please let me know if Im mistaken and where within sandicor this is. Thanks!
You can pull their data into
You can pull their data into excel and run whatever calculations you want… they supply price and square footage.
rich
Thanks Rich… That must be
Thanks Rich… That must be a ton of data to sort. So are you using all of the zips within San Diego County?
Yes…
rich
Yes…
rich