All the gloom and doom about the national market notwithstanding, the
median price per square foot of San Diego resale homes nudged up again
in May:
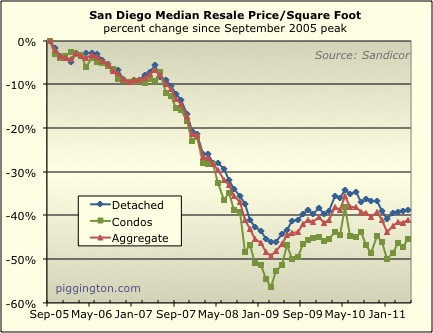
The increase wasn’t terribly impressive… for the month, this price
indicator was up .5% for single family homes, 3.1% for condos, and 1.1%
in aggregate. (The single family series is the most reliable and
should be given the most weight). But any increase at all seems
like a positive in the wake of the pessimism that resulted from the
March Case-Shiller
release.
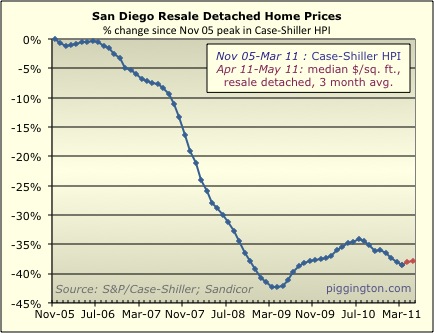
On that note, here’s a look what the April and May Case-Shiller numbers
may look like if the median price per square foot is giving a good read
on actual price changes:
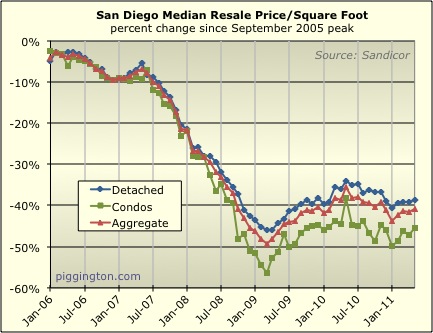
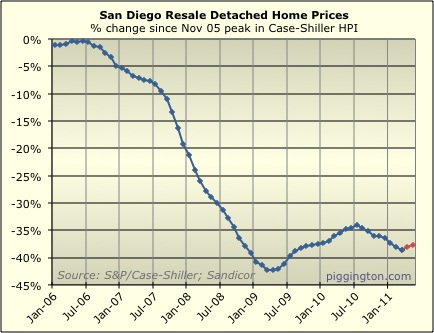
Same two charts, lined up by calendar year. We are in what is
typically the strong season:
The number of closed sales increased slightly. Sales were below
their year-ago levels, but the tax credit stimulus was still in place
in May 2010 so I don’t think that’s very meaningful:

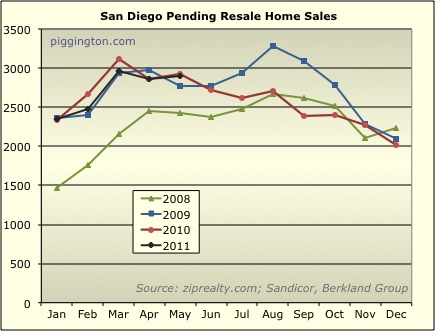
Pendings also were up a bit, and were pretty much unchanged from a year
ago:
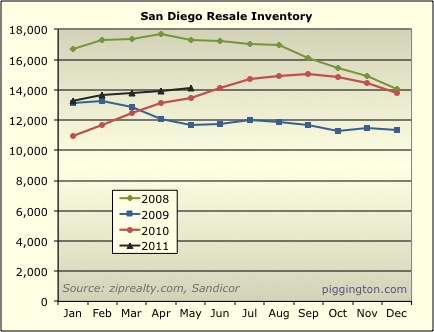
Inventory rose slightly once again:
And months of inventory remained flat at just under 5 months:
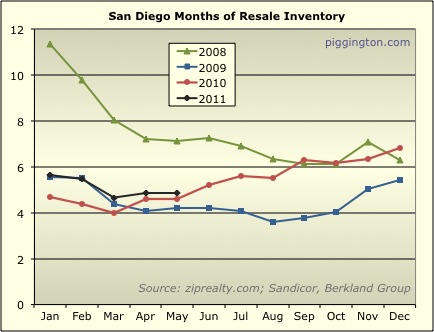
The balance between supply and demand looks healthy enough… slightly
above 2010 levels but not by much (and with no tax credit stimulus
about to expire).
For those seeking the next big leg down in housing, it doesn’t seem to
be happening here in San Diego. Of course, we are in the
strongest part of the year, so the market could weaken down the
road. But for now, it continues to hang in there.
Hey Rich, just a heads up, I
Hey Rich, just a heads up, I was reading this over at VoSD.com and it looks like the last graph (Months of Inventory) is broken over there.
Thanks afx! It’s fixed
Thanks afx! It’s fixed now…
BTW probably no need to read the Voice versions of these… I do two versions of the big monthly report because with the pigg version I can be nerdier, more data-y, and most important I can assume a level of background knowledge that I can’t over at Voice. So the versions here should typically have more data and musings but less background that you already know.
Ahh, I had subscribed to
Ahh, I had subscribed to VoSD’s RSS feed back in ye olden tymes, so I always ended up reading that version first. I’ve updated my subscription to Piggington instead. Thx for the tip.
If you cut the graph off at
If you cut the graph off at Jan ’09, this all looks really normal. No wonder we have all these political threads – that’s all there is to talk about when the real-estate market is all normalish and stuff.
Would be interesting to see a graph from 2000 to present with the bubble points (say 2003 through 2008) left out.
I would be willing to wager
I would be willing to wager that the trends will stay intact bumping along until we see a change in interest rates. Once long term rates bump into the 6% territory there will be some impact after a “period of realization” by sellers.