An oft-heard theory regarding the foreclosure situation goes something like this: the overabundance of risky mortgages may cause a lot of defaults, but lenders won’t be able to afford to foreclose on too many borrowers. Therefore, lenders will be more flexible than they have been in housing busts past, allowing delinquent borrowers more time or easier loan terms to help them get back on track.
We can test this theory fairly well using available data. But first, a terminology refresher. A Notice of Default (NOD) is a letter sent to a delinquent borrower saying, in effect, "pay up or else." A Notice of Trustee Sale (NOT) is filed upon the occurrence of the "or else" — when the lender takes back the home. The law dictates that the lenders can’t take back the home and file the NOT until three months after the sending of the NOD.
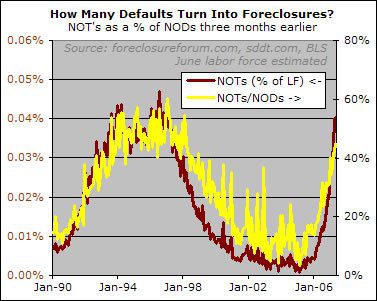
That three-month delay is not by any means set in stone, but it seems to be a fairly typical timeline between an NOD and the ensuing NOT. Thus, by dividing the number of NOTs filed in a given month by the number of NODs filed three months earlier, we can get a rough idea of how many lenders are actually going through with the foreclosures they’ve threatened against delinquent borrowers.
Michelle Steffes
So if the
Michelle Steffes
So if the NOD’s are not turning in to NOT’s what is happening to the homeowner? Is there any way of finding this information?
The not-so laid back theory
The not-so laid back theory of lenders says “hey, the downturn just started”. 2007 is like 1992. In which case, we see the lenders are being much more harsh, foreclosing over 40% while in the ’92 era they only needed to foreclosure 25-30%.
Also, I don’t see the 4% of the NOD rate until 1994. The 54% NOT rate looks to be pretty solid in the bottom of the 1994-1998 range. The fact that we’re already pushing a NOT rate above the ’94 rate to me says we’re going a lot higher in NODs/NOTs.
Rich one thing that I have
Rich one thing that I have seen is many a case where even after the NOT is filed that the property will not make it to trustee sale. I think the NOT/NOD ratio is a decent metric and should be done consistently over a period of years but I think you would find the NOD/REO ratio to be much different.
SD Realtor
So at the .04% data point we
So at the .04% data point we are seeing about a 17% reduction in the number of foreclosures as compared to ’93. Not an insignificant drop – but not earth-shattering either. This is good data to plot as we move along. Of course there are lots of wrinkles that may come to bear on this ratio, not the least of which would be the identification of soon-to-be exploding re-casts that are then modified in advance of an NOD even being issued. And lenders sitting on inventory to avoid flooding the market. Nevertheless, good stuff.
What’s missing??? There is
What’s missing??? There is no statistical data for SHORT SALES or DEEDS IN LIEU OF FORECLOSURE.
What’s missing??? There is
What’s missing??? There is no statistical data for SHORT SALES or DEEDS IN LIEU OF FORECLOSURE.
Short sales and Deeds in Lieu of foreclosure also existed during the last down market as well. The NODs and NOTS from that time also don’t reflect those components of the market. So what’s the point ? Is there a reason to believe that the relative amounts of short sales and deeds in lieu will be different this time ?
Thanks, Rich as always.
I
Thanks, Rich as always.
I think this data is way too noisy to draw any conclusions yet, especially since many factors play into the ratio of NOT/NOD and lender disposition is only one of them.
Think about it. Where is the asymptote of the NOT/NOD curve? 100%? No. Historically, some % of folk figure out a way to save their butt when they get the NOD. My point is, we would expect the NOT/NOD ratio to level out at some value eventually within some noise band.
It really does not matter much. The thing that really matters is the absolute number of must sell inventory on the market as a percentage of all inventory. Who cares if NOT/NOD is only 45% (instead of 50%) if there ends up being 2000 NODs/month? That difference equates to 900 foreclosures instead of 1000 hitting the market per month when sales are around 1800 units/mo. The difference, and the consequential impact on prices, is trivial. Either way, all those NOTs (as a percent of sales) are going to put big time pressure on prices.
It will be fun to watch this ratio over time and see if any trends show up.