Sorry y’all, this month got away from me. Below I have posted the August charts.
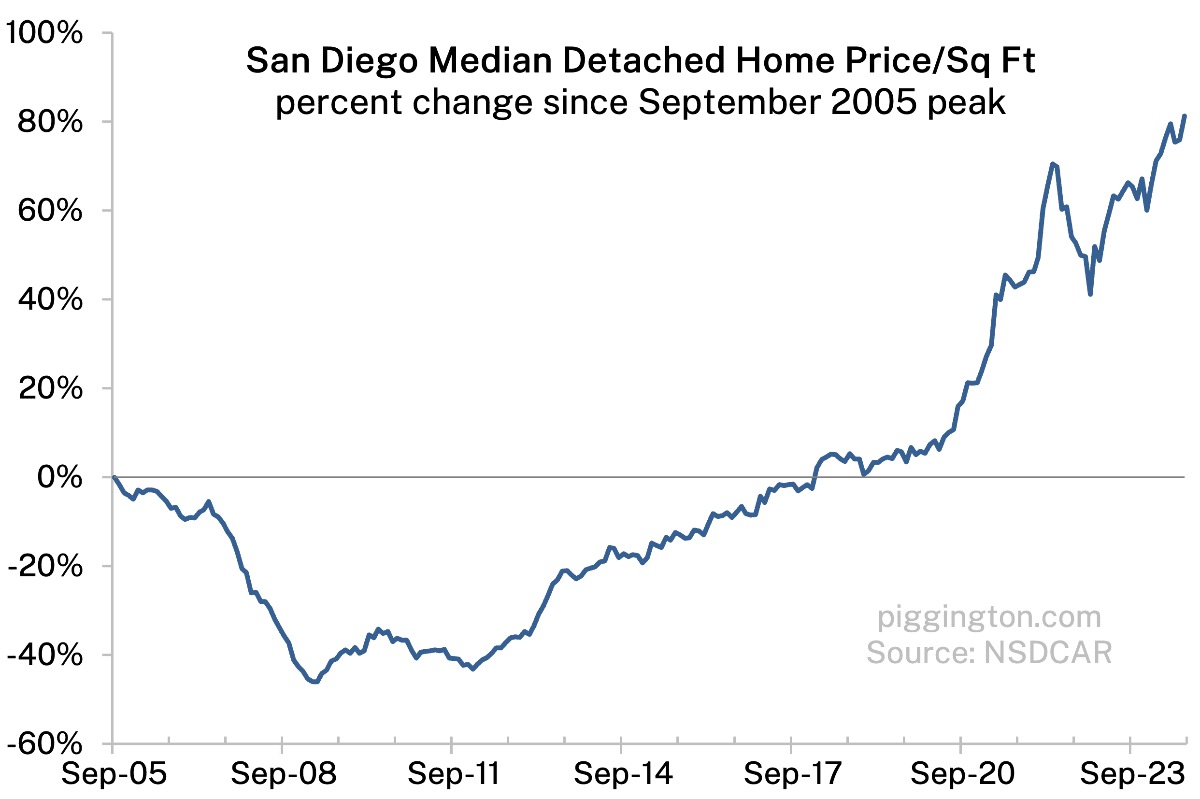
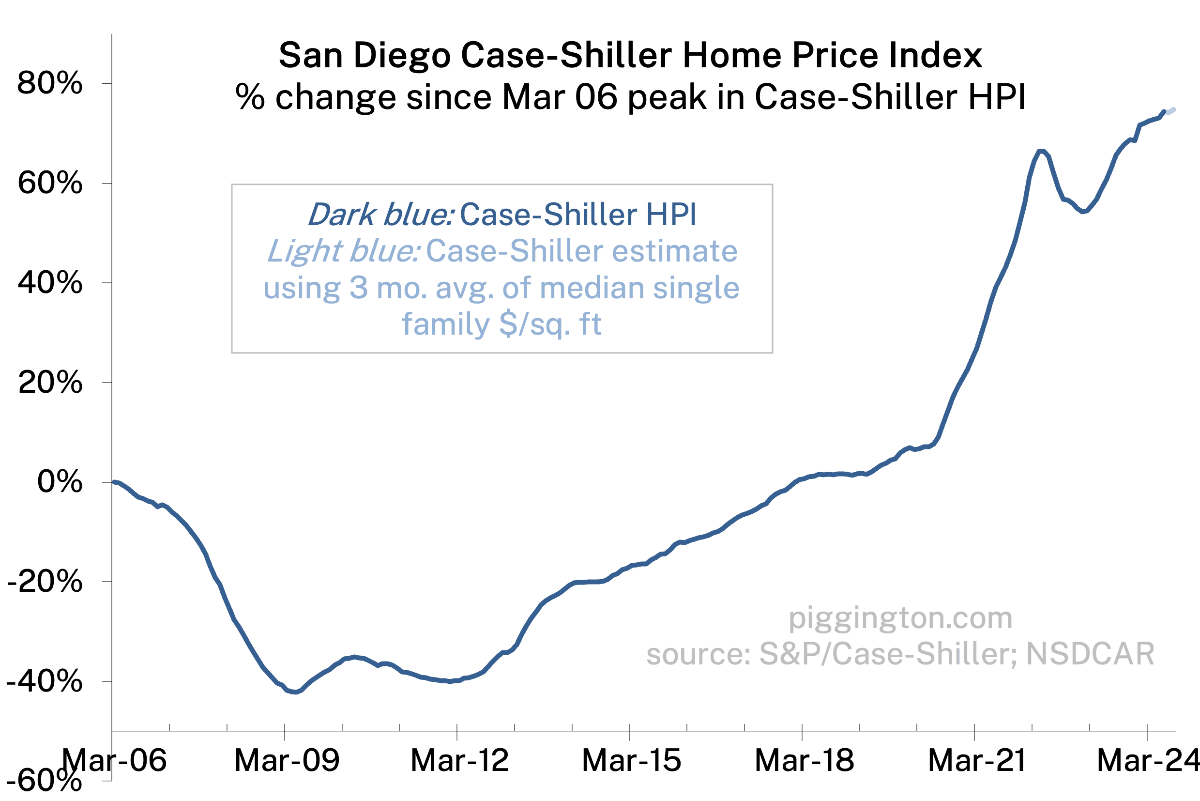
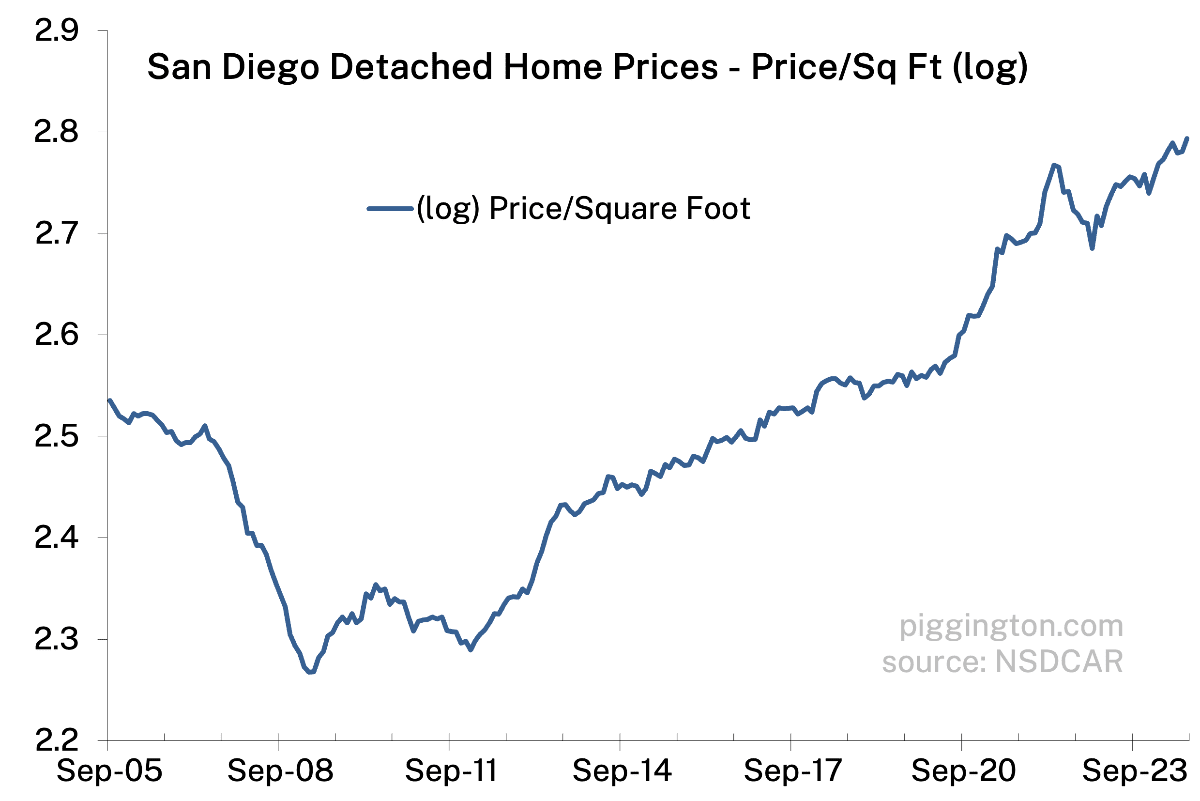
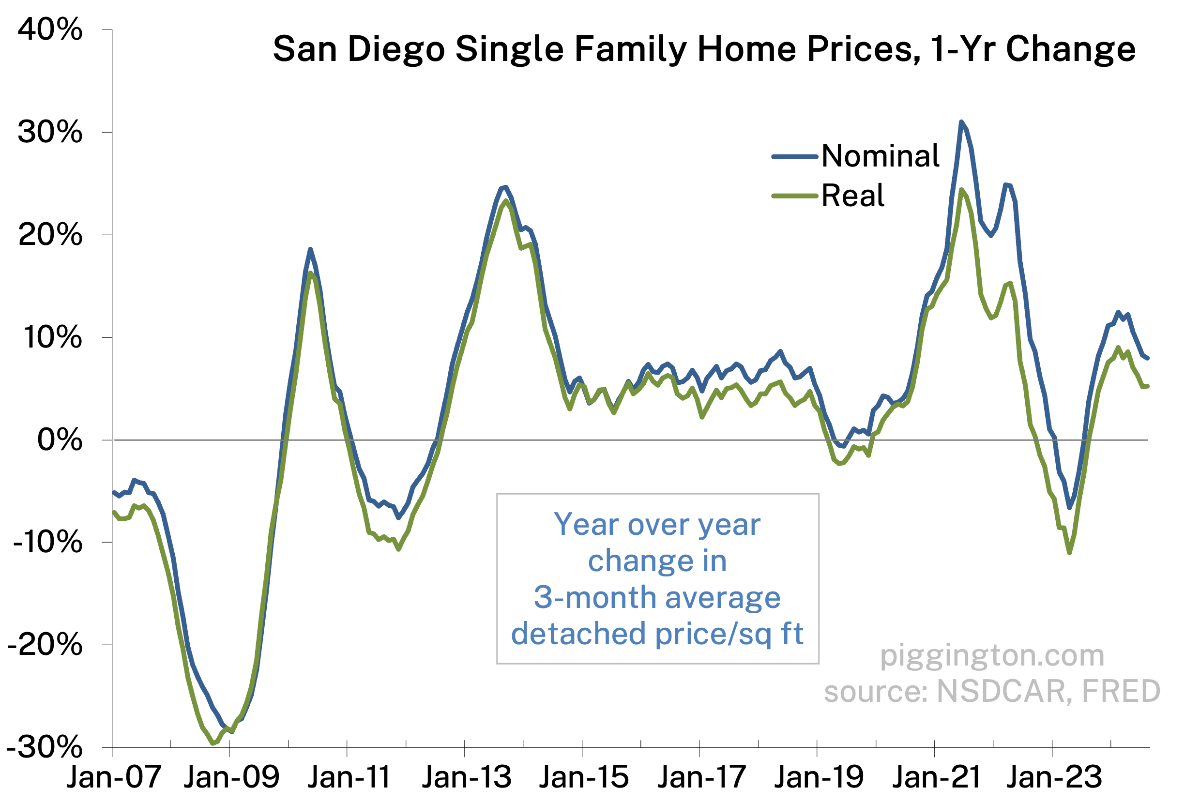
Not a ton to report here. The price per square foot popped, but it’s a noisy series and the 3-month average was pretty flat:
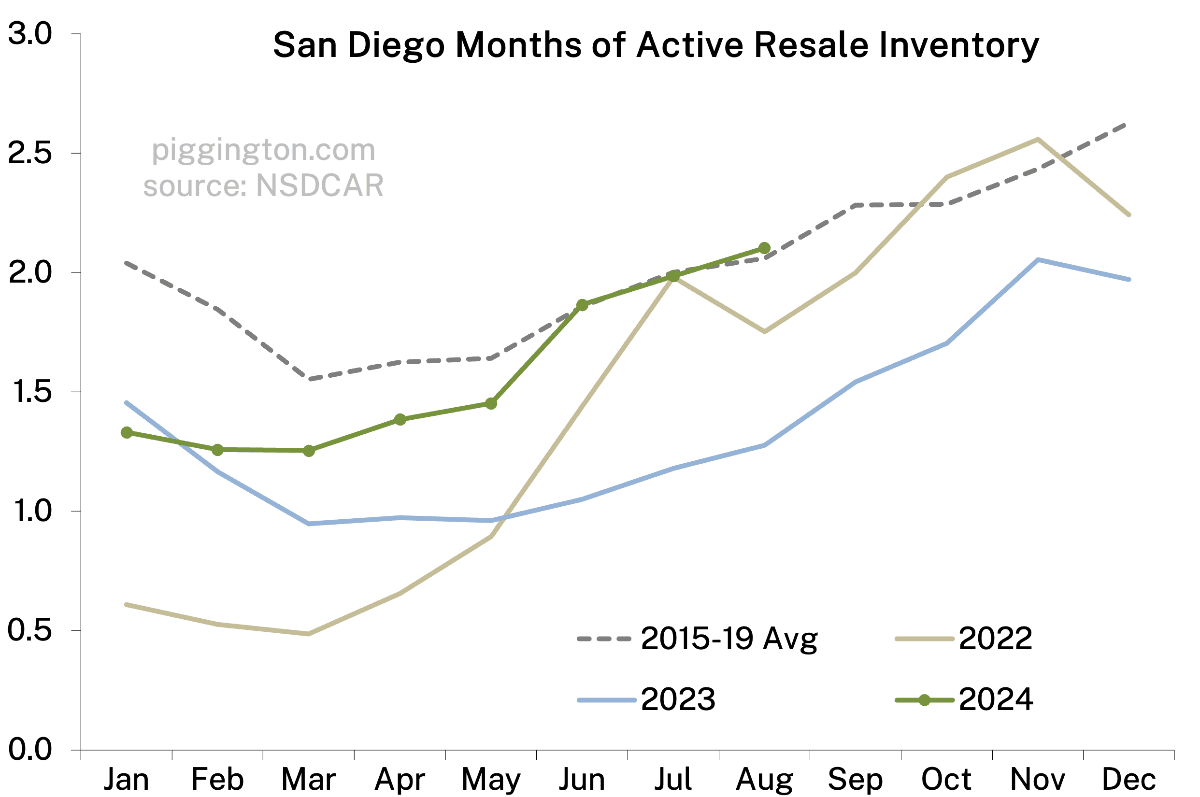
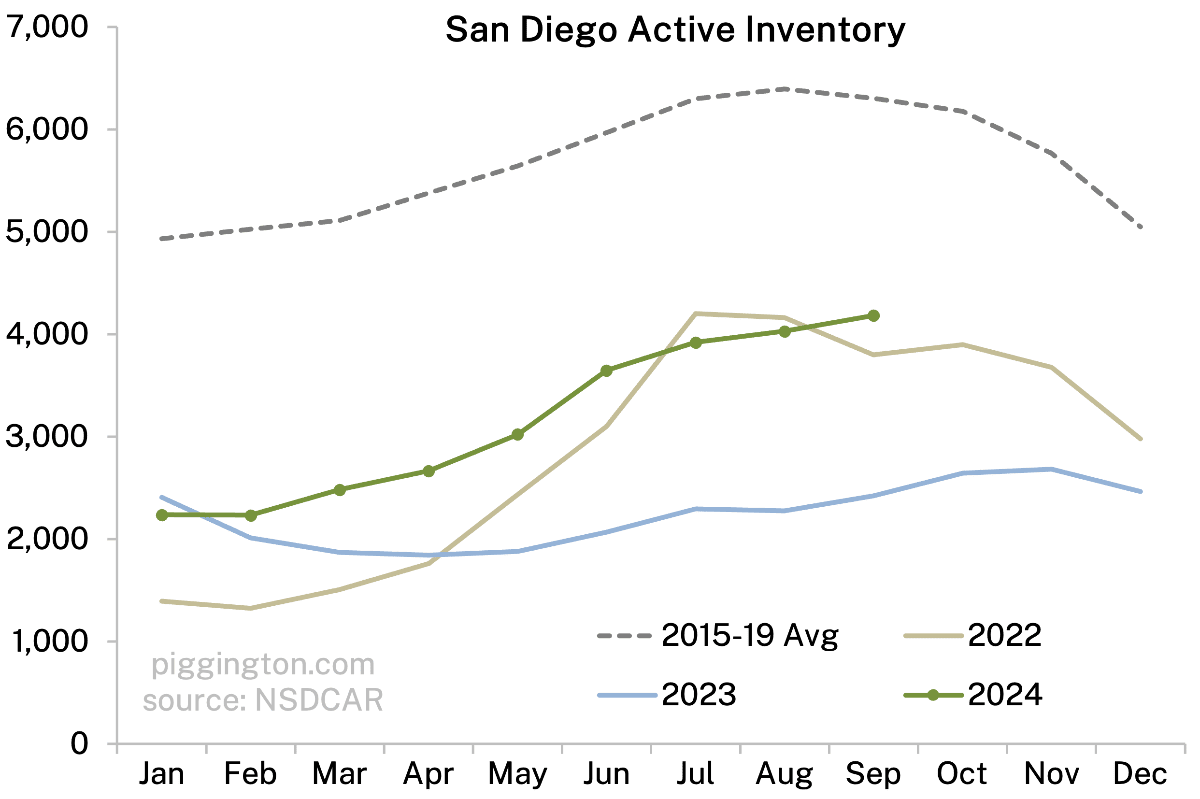
Meanwhile, the months-of-inventory measure continues to follow right along with the pre-Covid average (albeit with both inventory and monthly sales running well below):
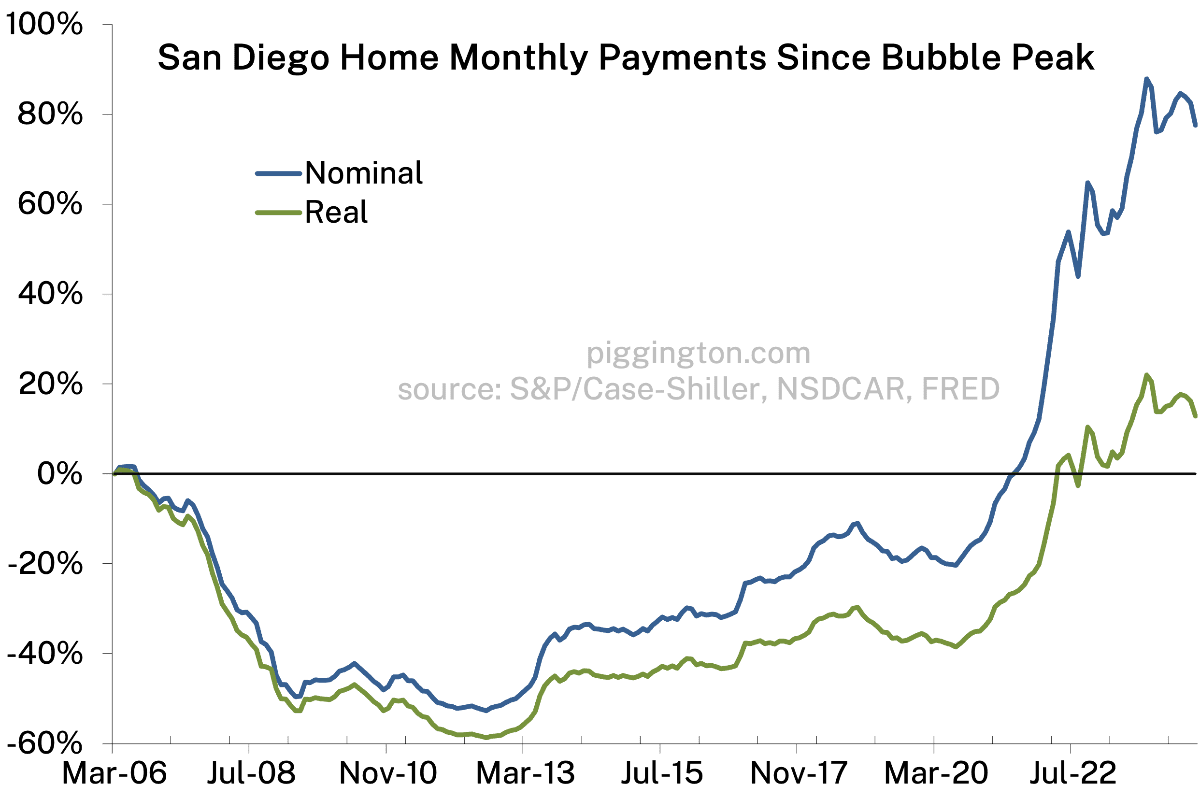
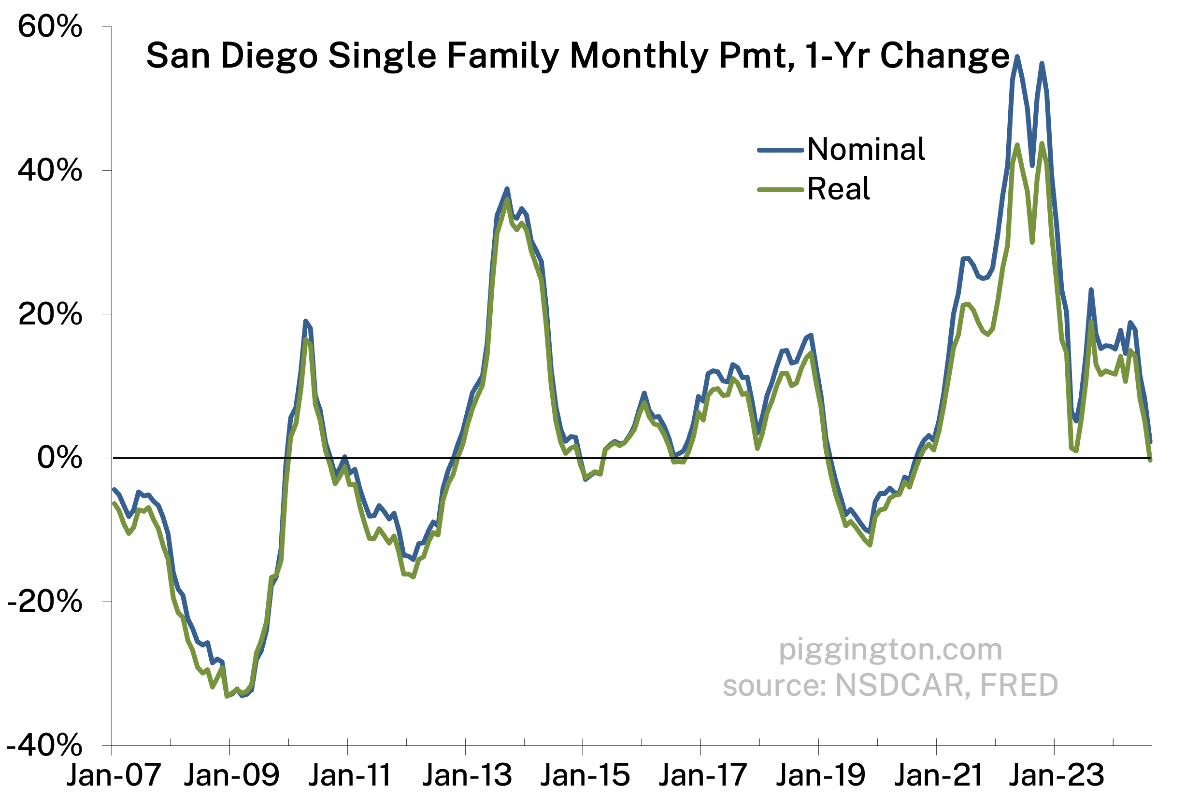
 There was some relief on the monthly payments front as the 30-year mortgage has declined recently. Still pretty brutal though.
That’s all I’ve got… more charts below.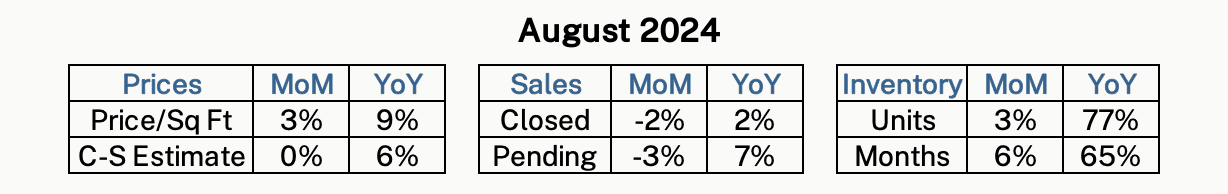


Sure has been quiet around here, seems the Piggs are mirroring the housing market participants (ie: not transacting much or commenting on housing blogs).
It would be interesting to see a price to rent analysis. As a potential buyer, I just cannot justify the enormous premium to buy right now when I can rent the same house for so much less, at least in my market of Carlsbad.
I agree – but that is assuming these people are putting down 20% on these new home purchases, specifically the larger SFH. From my experience, those purchasing the larger SFH are “moving up” from their starter homes/condos they bought from 2011-2019 and rolling that large equity into their new home, putting down large down payments (40%+) keeping the monthly payments lower.
I would be curious to see if there is any data to show what the actual monthly mortgage payments for these new home purchase are compared to rent.
evolusdv2 check out this for price to rent analysis: https://piggington.com/july-valuations-price-rent-and-monthly-payment-rent-ratios/
Thanks, missed that one and it’s exactly what I was hoping to see. Seems mortgage payments during 2013 – 2019, which seemed like a ‘normal’ market after the great recession and before the pandemic, were ~1.25x rents. This makes sense as you have the Principal portion of the payment that isn’t really an expense, so net they’re likely similar. In that scenario I could justify putting 20-30% down payment. Currently the > 2x metric is just outrageous, though it’s likely falling quickly given the steep rate declines recently. Thanks, Rich.
August was a slower month for sure. Rates have dropped significantly going into the slow season. The house closings I was previously watching all did well closing at their list prices of the time. So, good product continues to move well.