Prices
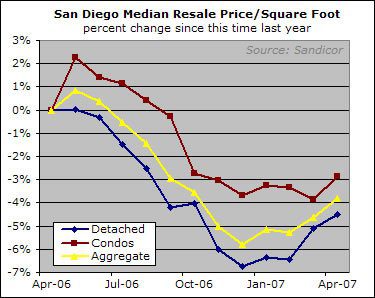
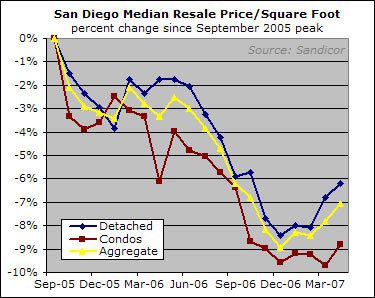
The median price per square foot, aka the size-adjusted median, was up in April for both property types, though still down from a year ago and from the November 2005 peak:
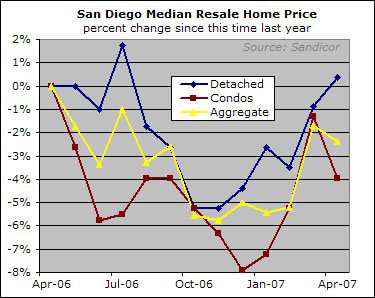
For monthly numbers I focus on the size-adjusted median — the reasons are discussed in lurid detail here. Everyone else looks at the plain-vanilla median,despite the fact that there are several confounding factors that are throwing it off right now, so let’s just have a look at what they are seeing.
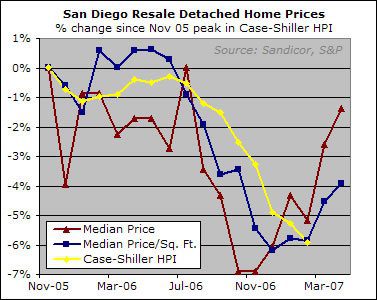
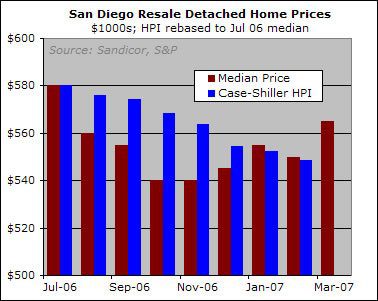
And for good measure, here’s the most current Case-Shiller HPI data along with the median and size-adjusted median for single family homes (from the November 2005 HPI peak):
Supply and Demand
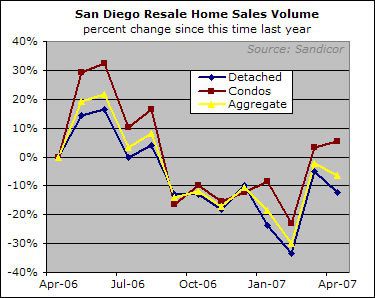
Sales were down overall, though condos had a particularly weak April last year so the y-o-y comprison is positive for them.
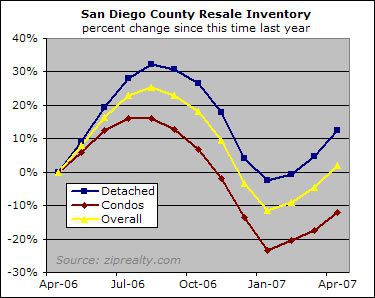
Inventory has crept up at a steady pace month over month. As of April, it was at about the same level as it was a year prior overall. However, the composition has shifted to include more single family homes and fewer condos compared to last year.
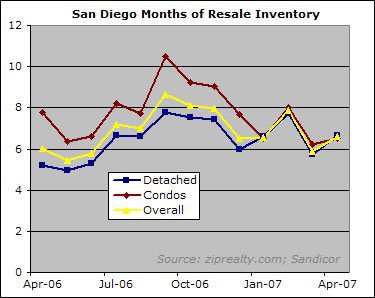
The overall months of resale inventory figure was slightly higher than during last April, at 6.6 months.
Conclusion
I believe there are two factors at work here. One is the seasonal bounce, which tends to take place even during bear markets. This "spring fling" may be encouraged by the rampant bottom-calling, even by such level-headed analysts as the Anderson Forecast, who have (mistakenly, imho) looked at the rising median price and concluded that prices are very near their eventual lows. Regarding their specific assertion that prices have stabilized in the past six months, I will just include the following chart:
Folks who want more details can see a Voice article on the topic.
In any case, we have the tendency towards seasonal strength possibly coinciding with a dead cat bounce-style wave of optimism. And reports from the field made by realtors in the Econo-Almanac forums make it clear that the spring bounce is happening to at least some degree, in at least some areas.
On the other side of things, there is the subprime tightening. A recent Inman News article noted the results of a recent poll of 55 brokers:
The brokers were unanimous in reporting a tightening of underwriting requirements:
- 100 percent loans are much more difficult to find, with the remaining subprime lenders now requiring 5 percent or 10 percent down.
- Stated-income loans, where income is not verified by the lender, are no longer available for subprime borrowers with income derived from salaries or wages.
- Minimum credit (FICO) scores are up by 30-50 points, depending on other characteristics of the transaction.
- Borrowers are being qualified for adjustable-rate mortgages using the fully indexed rate (the most likely rate at the first adjustment) rather than at the discounted initial rate.
Some of those are a big deal — with prices this high, even coming up with a 5% down payment will rule some people out. Same goes for being qualified at the fully indexed rate. As a result, some people are being knocked out of the market, and by and large those people are the low-end or entry-level buyers. So we have a decrease in activity that is focused on one end of the buying spectrum.
These two forces are interacting in weird ways. Volume is somewhat weak, which makes sense given the reduction of qualified buyers. But prices actually appear to be strengthening, as the aggregate size-adjusted median has increased by 2% since December.
Is the apparent price bounce a genuine manifestation of seasonal strength? Or is it an illusion caused by the reduced presence of the low-end buyer? Adjusting the median price for size certainly gives us a better read than we’d get with the vanilla median, but square footage is but one manifestation of quality so there’s just no way to be certain. The Case-Shiller index suggest that the price gains through February were an illusion, but the March data isn’t even available yet, so that doesn’t help on the more recent months.
So I don’t think there is a clear answer, but I would suggest that it doesn’t matter. There is ample precedent for spring bounces occurring during prolonged downturns, so if that’s what’s going on, I have no reason to change my view that we are in what will be a prolonged downturn. And if there isn’t an actual price bounce taking place, then there’s even less reason to change my view.
Either way, once the seasonally strong period has ended, the tightened lending will still be there and may even have gotten worse.
In the meantime, while it’s fun to watch the month to month data, overthinking it is not very good use of time. Big, sweeping trends like housing market booms and busts take a long time to play out. But they do play out in the end.
Rich,
Do your statistics
Rich,
Do your statistics include or exclude houses bought by banks during foreclosure auction?
Do you have data for
Do you have data for previous years? I would like to see this graph going back a few years. Is the lowest point in the year always around December?
PD –
Don’t know if you saw
PD –
Don’t know if you saw this. It’s not the same graph, but it clearly shows seasonal fluctuations in the last downturn based on Case-Shiller HPI …
http://piggington.com/mini_rallies_arent_meaningful#comment
Thanks, FSD. I wanted to
Thanks, FSD. I wanted to look at at how the spring selling season affected price. From eyeballing the graph, it looks like the spring selling seasons had bumps of 2% in 91, 1% in 92, .3% in 93, 1.9% in 94.
The increases never reached the low from the previous year.