Let’s review home price measures a bit.
The average price isn’t very useful, because it can be skewed by an outlier. If someone helicopters in and buys the most expensive property in San Diego, that tells you nothing about price movements for the rest of the market, but it will push up the average sold price.
So, it’s more common to use the median, which you get by putting all the values in order and picking the middle one. This will give a better read on the price movements of the entire series, without being distorted by outliers at the end. But the median can be distorted by a change in the composition of what’s selling. If buyers purchase more expensive homes in month 1 and cheaper homes in month 2, the median price will fall, even if the value of individual homes hasn’t changed.
This can be partly addressed by measuring price per square foot. This adjusts for the size of the home, which reduces the impact of compositional changes. But it still fails to account for important factors such as the location of the house, its state of repair, its view, etc. So the median price/square foot remains a pretty rough gauge of home price movements.
The Case-Shiller home price index actually measures repeat sales of the same homes in order to construct a model of how much prices are actually changing. There can be some distortions here as well (e.g. the impact of remodels) but the index applies some statistical techniques to minimize these, and they are a much smaller issue than those afflicting the other metrics. (See footnote 2 in this article for more). So, the CS index is by far the best measure of area home prices. The problem is that it’s laggy — it takes a couple months to come out, and averages 3 months of sales data. So it’s the most accurate but won’t tell you what went on last month.
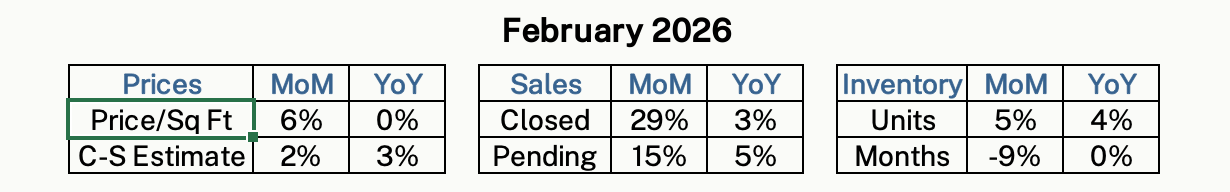
I thought this was a good time to review the price metrics because there was a surprising 5.6% increase in the median price per square foot last month:

Why surprising? Because the supply and demand situation doesn’t seem to have changed in any meaningful way from the doldrums of the recent past. Months of inventory did drop — which is positive for prices — but only to the same level as last year, and comfortably above the pre-pandemic average:
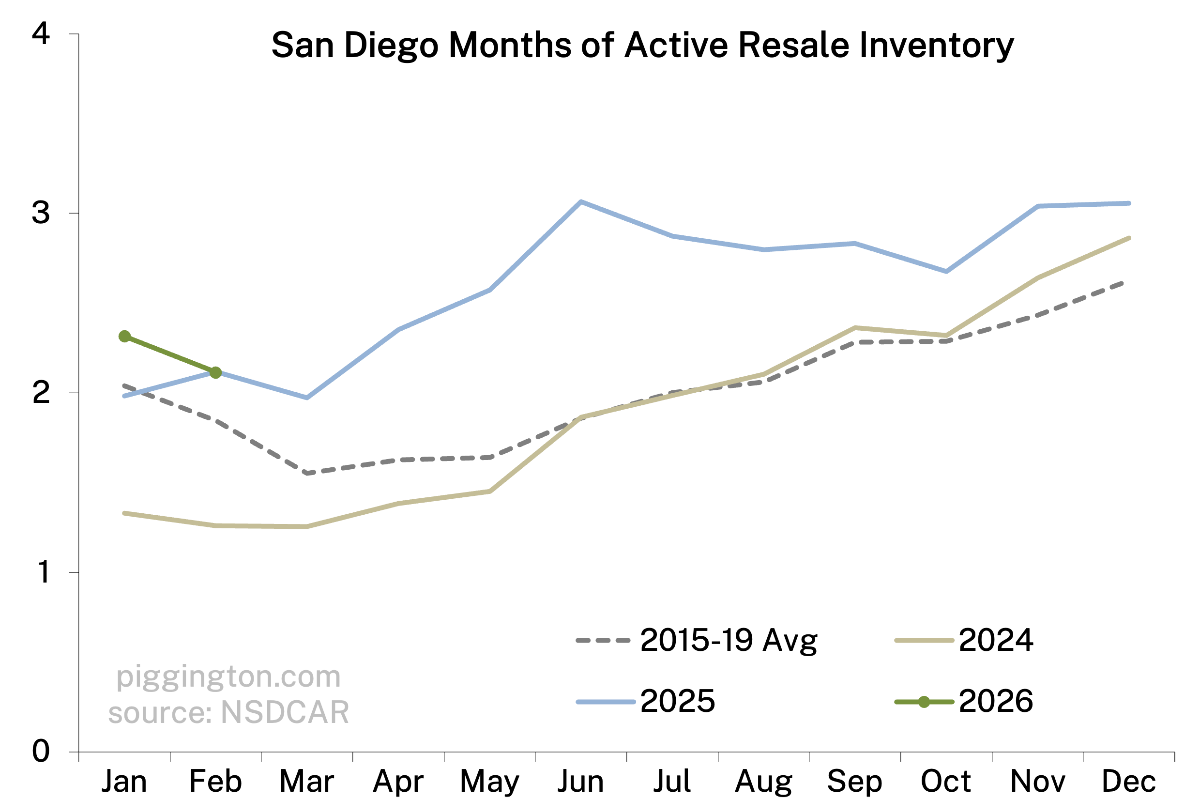
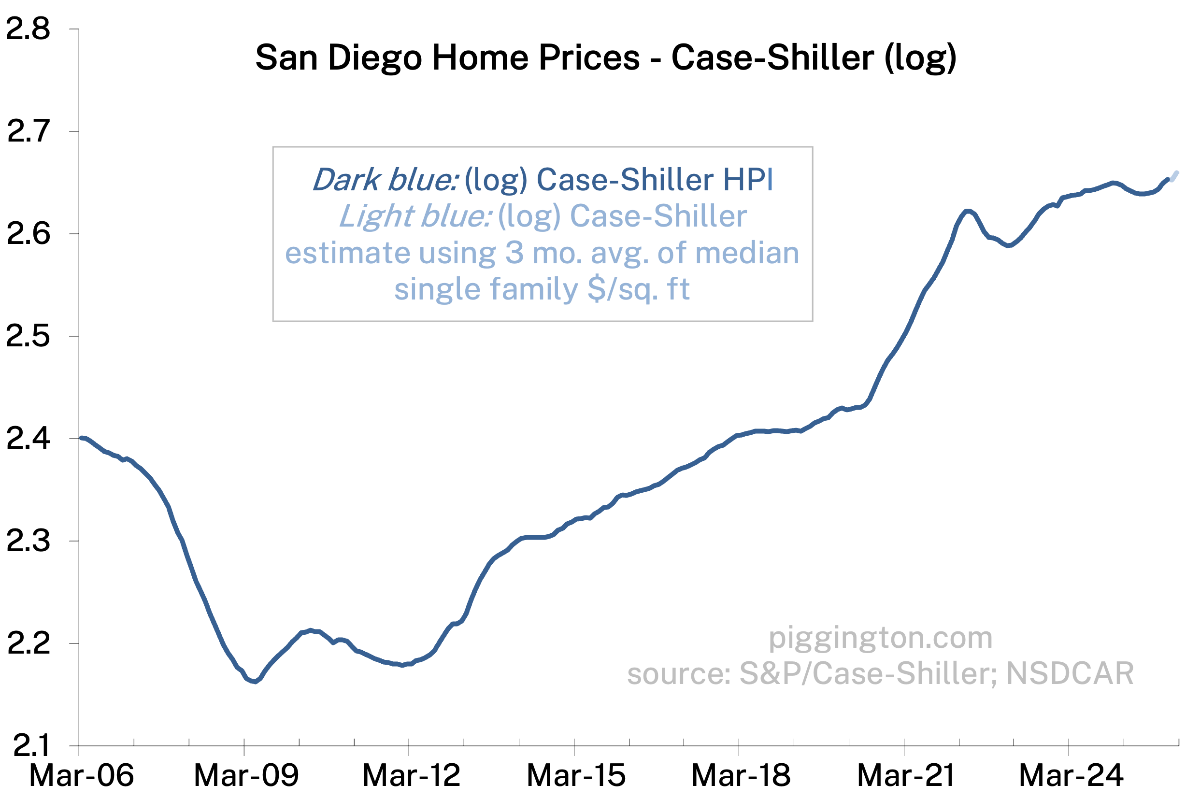
The idea of a dramatic price surge without a dramatic change in supply/demand seems a little fishy, which at first glance suggests that this is more about compositional change than a real price increase. However, a look at the CS index suggests another possibility…
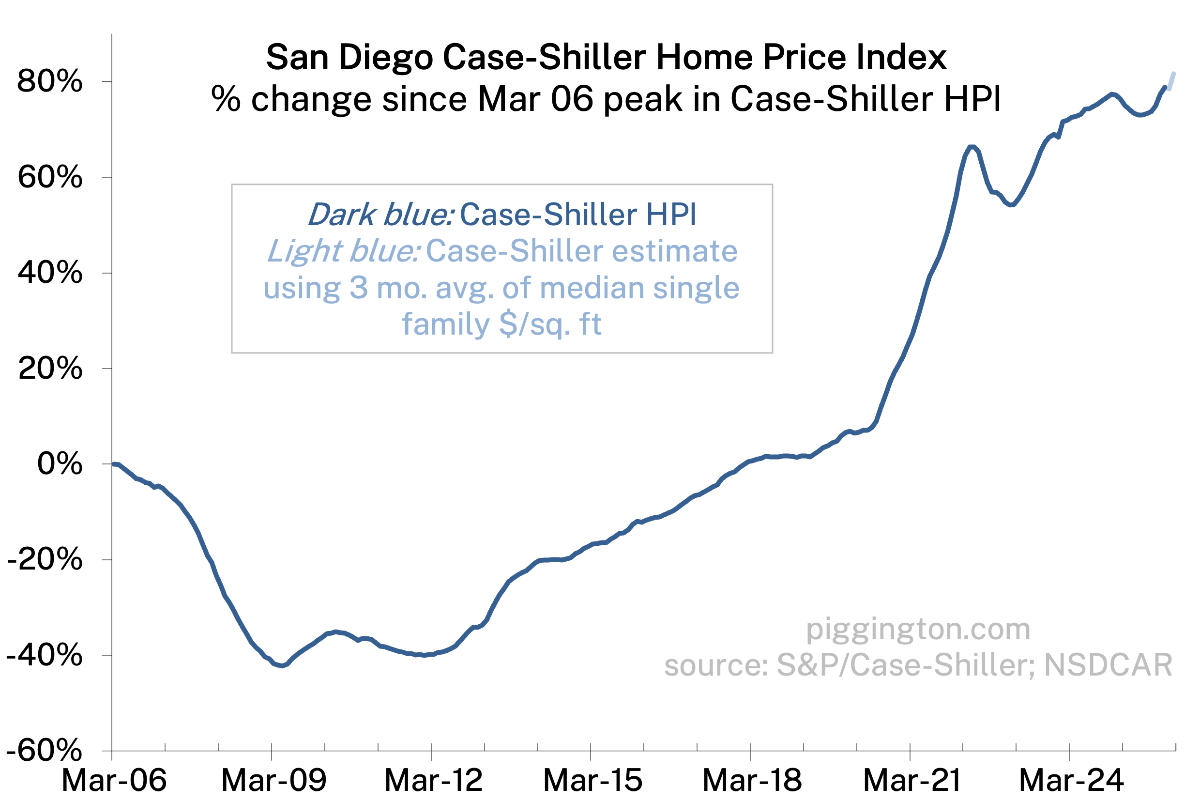
Ignore the light blue line, as that’s my attempt to estimate the CS by just averaging a few months of price sq/ft data. The dark line is the actual CS index. Note that as of the last release (December) it had narrowly attained a new high.
Now look back at the price/square foot chart. That had remained well below the recent high — until last month! So I actually think it may be the case that there was a compositional distortion, but it was in previous months, as the price/sqft understated price growth. And last month, the price/sqft caught up to actual underlying price changes.
I hope that makes sense. Feel free to ask q’s in the comments if not. And as usual: more graphs below…